Fig 1.

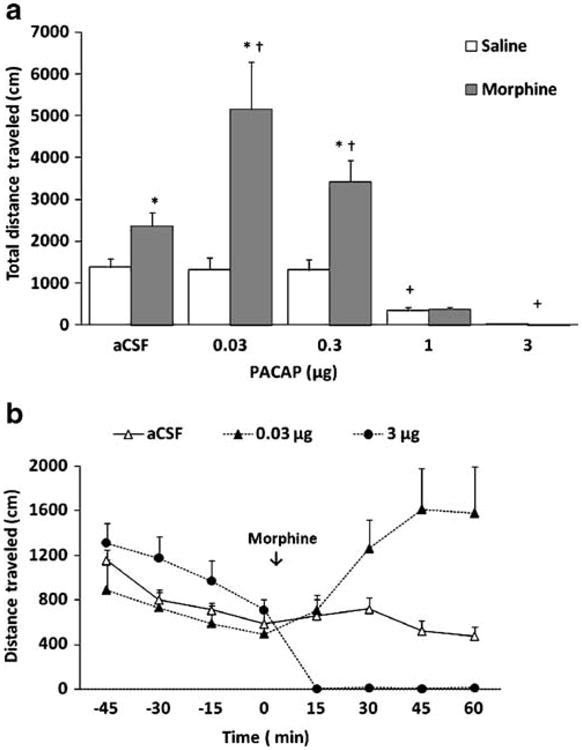
Effects of intracerebroventricular PACAP administration on basal (white bars) and morphine-stimulated (black bars) motor activity in C57BL/6 mice. Data are mean (±SEM) of the total distance traveled during the entire 1-h test period (a) or the distance traveled at 15-min bins of mice (n=6–12 mice/dose for each treatment) treated with aCSF, low or high PACAP dose (b). Asterisk indicates a significant increase compared to their respective saline-treated control group (open bars; p<0.05); Dagger indicates a significant increase compared to aCSF-morphine group (p<0.05). Plus sign indicates a significant decrease compared to their respective aCSF-treated control group (p<0.05)
