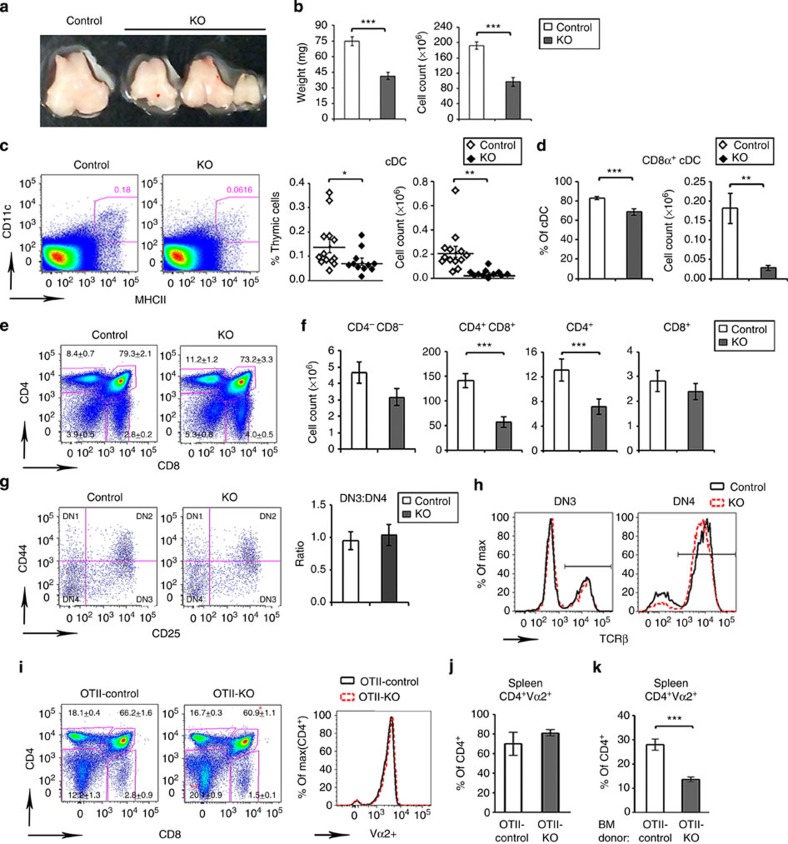
Figure 5. Alterations in the thymus precede development of arthritis in the CD11c-Flip-KO mice.
(a,b) Representative photos of thymi, which were analysed by weight and cell count (n=25–27 per group). (c) Identification of total cDC and (d) the CD8α+ subset, presented as percent and total number. cDCs were defined as CD64−CD11c+MHCII+ (n=11–13 per group). (e,f) Thymocytes were characterized for the (e) percent and (f) number of CD4 and CD8 as CD4−CD8−(DN), CD4+CD8+ (DP) and CD4 or CD8 SP (n=8–9 per group). The numbers in the histogram (e) represent the means±s.e for each population. (g) Development from the DN1 through DN4 of CD4−CD8− thymocytes determined by antibodies to CD25 and CD44, and the ratio of DN3/DN4 (n=8–9 per group). (h) Representative overlay of intracellular TCR-β expression in DN3 and DN4 cells (n=3 per group). (i) Comparison of the thymocytes in mice crossed with OTII, genotyped as OTII-Flipflox/flox, CD11c+ (OTII-control) and OTII-Flipflox/flox, CD11ccre (OTII-KO; n=4 per group). The expression of OTII transgene Vα2 in CD4+ T cell is overlaid (right panel). (j) Assessment of clonotypic CD4+Vα2+ T cells in spleens of OTII-control mice and OTII-KO mice (n=4 per group) and (k) of irradiated RIP-mOVA recipients that received the BM from OTII-control or OTII-KO donors (n=7–10 per group). The data are presented as percent of CD4+Vα2+ cells of all CD4+ cells. (*P<0.05, **P<0.01 and ***P<0.001, unpaired two-sided t-test).

