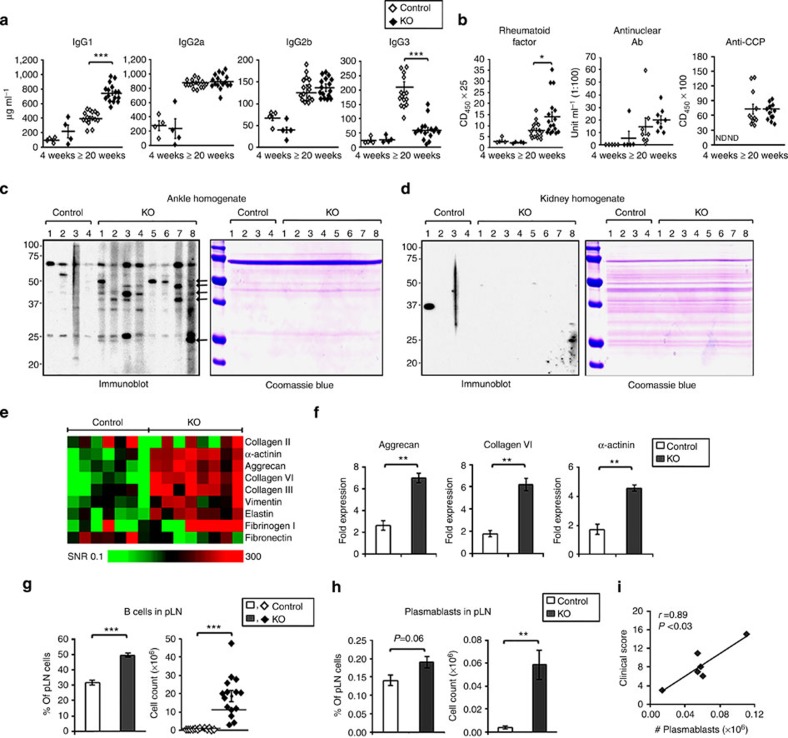
Figure 6. Autoantibodies and increased B cells and plasmablasts in CD11c-Flip-KO mice.
(a) Quantification of serum IgG subclasses by ELISA (μg ml−1) in the CD11c-Flip-KO (KO) and control mice. (b) ELISA quantification of serum RF, ANA and antiCCP (lower panel). Values are presented as OD450 × serum dilution for RF and anti-CCP and units for ANA. (c,d) Immunoblotting of ankle (c) and kidney (d) homogenates from Rag−/− mice employing individual serum randomly selected from control and CD11c-Flip-KO mice (≥20 weeks) and a duplicated tissue blot stained with Coomassie blue R250. The arrows identify protein bands common between individual CD11c-Flip-KO but not in control mice. The blots are representative of three independent experiments. (e,f) Antibodies identified by autoantigen array. (e). Heatmap of IgG antibodies to joint-related antigens, generated as the signal-to-noise ratio (SNR) for each antigen (controls n=7, CD11c-Flip-KO mice ≥20 weeks with arthritis, n=8). (f) Three autoantibodies in the array were significantly increased following the Bonferroni correction in the CD11c-Flip-KO mice. (g,h) pLNs were examined for B cells (n=12–15 per group) and plasmablasts (n=6 per group) from mice ≥20 weeks. B cells were defined as CD19+B220+ and plasmablasts as CD19+B220+CD138+ in the CD64−CD11b− population. (i) Correlation (Pearson's) between the number of pLN plasmablasts and the arthritis clinical score for CD11c-Flip-KO mice just before killing. The values represent the mean±1 s.e. (*P<0.05, **P<0.01 and ***P<0.001, all panels unpaired two-sided t-test and in f unpaired two-sided t-test followed by the Bonferroni correction).

