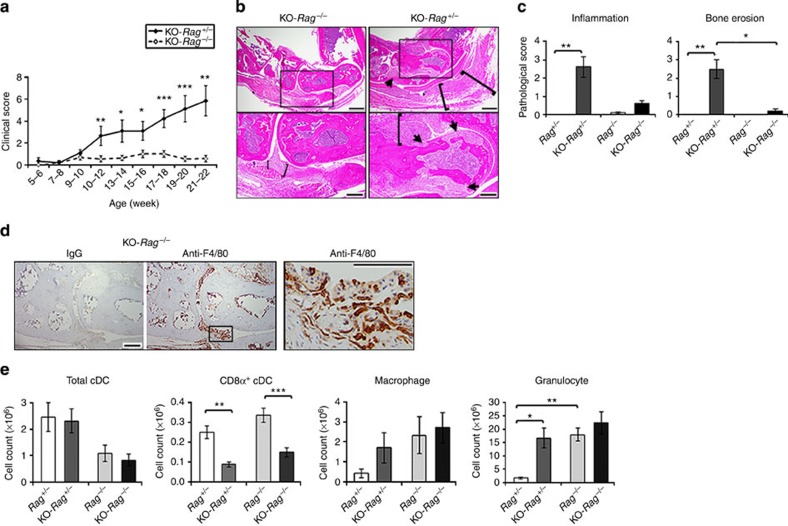
Figure 7. Reduced arthritis progression in KO-Rag−/− mice.
The CD11c-Flip-KO mice were crossed with Rag−/− mice to generate the KO-Rag−/− line. (a) The spontaneous development of arthritis in KO-Rag−/−mice was compared with the littermate KO-Rag+/− mice (n=7–10 KO-Rag+/− mice and 7–16 KO-Rag−/− at the observed time points). No arthritis was observed in the Rag−/−or Rag+/− mice. (b) Representative (of four to five per group) H&E histology of ankles of KO-Rag−/− mice and KO-Rag+/− mice. The arrowheads identify bone erosion and pannus formation, and the brackets indicate inflammation. The boxed areas in upper panels (scale bar, 500 μm) are enlarged in the lower panels (scale bar, 200 μm). (c) The analysis of inflammation and bone erosion scores for ankles harvested from Rag−/−, KO-Rag−/− and KO-Rag+/− mice (n=4–5 mice for each group) harvested at the termination of the experiment (21–22 weeks). (d) Representative (of n=5) immunohistochemistry of joints from CD11c-Flip-KO mice for F4/80+ macrophages (scale bar, 200 μm). The boxed area in F4/80 staining is enlarged in the right panel (scale bar, 100 μm). (e) At the time of killing, spleens examined for DCs, macrophages and granulocytes (n=4–5 per group). The values presented are mean ±1 s.e. (*P<0.05, **P<0.01 and ***P<0.001; (a) unpaired two-sided t-test; (c) ANOVA plus Dunn and (e) ANOVA plus Tukey).

