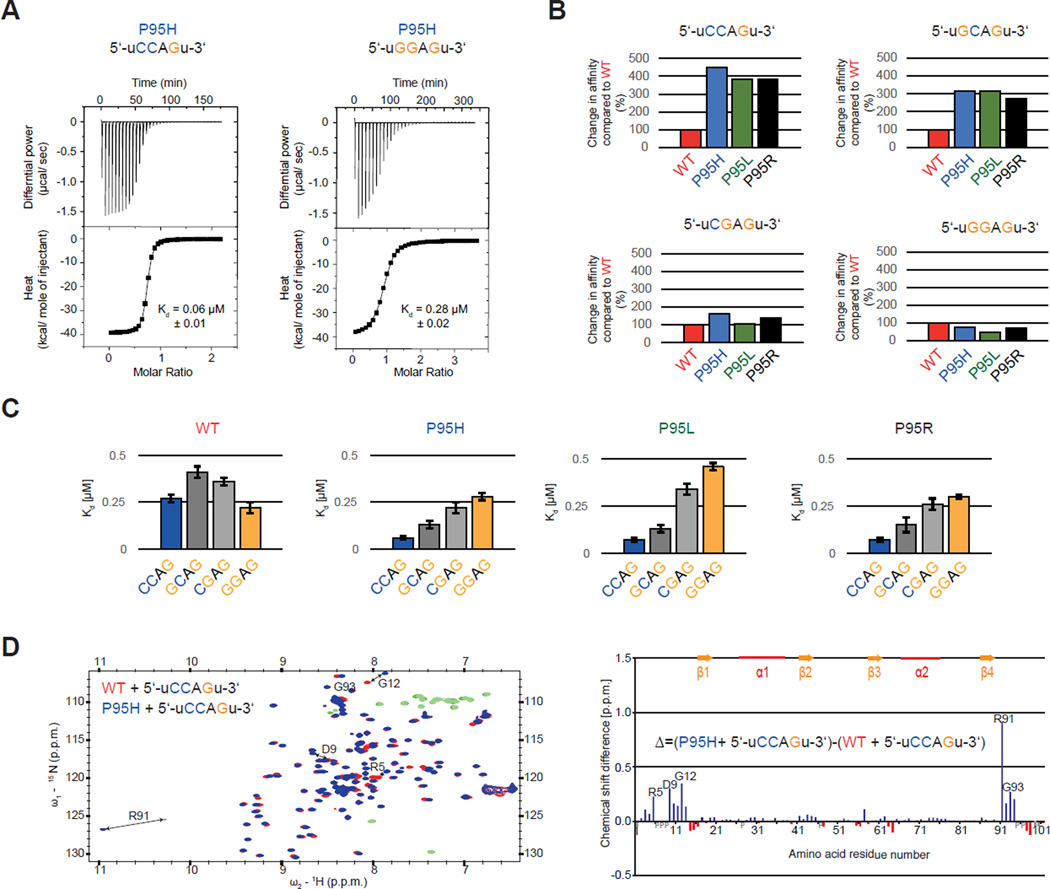
Figure 5. Proline 95 mutations change RNA-binding specificity of the SRSF2 RNA recognition motif domain (RRM) in vitro and lead to relocation of the N- and C-termini.
(A) ITC raw data and binding curve for SRSF2 RRM P95H mutant with 5’-uCCAGu-3’ and 5’-uGGAGu-3’ RNA. (B) Change in RNA-binding affinity (%) for SRSF2 RRM P95H (blue), P95L (green) and P95R (black) mutants compared to WT (red) (Daubner et al., 2012), using RNA targets 5’-uCCAGu-3’, 5’-uGCAGu-3’, 5’-uCGAGu-3’ and 5’-uGGAGu-3’. (C) Change in RNA-binding specificity of SRSF2 RRM WT, P95H, P95L and P95R with 5’-UCCAGU-3’ (blue), 5’- UGCAGU-3’ (dark grey), 5’-UCGAGU-3’ (light grey) and 5’-UGGAGU-3’ RNA (orange). (D) (left) Overlay of 2D [15N-1H] HSQCs of wild type (red) and P95H mutant (blue) bound to 5’-UCCAGU-3’ RNA, with negative peaks in green (WT) and light-green (mutant). (right) Difference of the chemical shift perturbations of P95H mutant and wild type. Positive values (blue) with a higher perturbation with the P95H mutant and negative values (red) with a higher perturbation with the WT are shown. Missing assignments are marked with grey bars and proline with a grey P. Residues with the highest difference are depicted in both graph and spectra. See also Figure S5.

