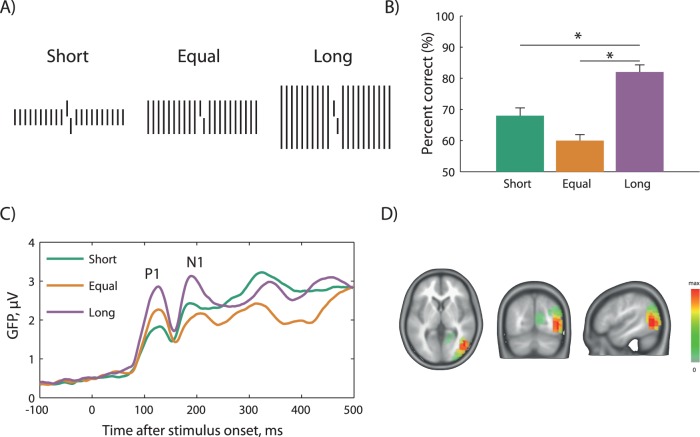
Figure 4.
Electrophysiological correlates of crowding. (A) A vernier target was presented in the fovea and flanked by arrays of short, equal length, or long lines. (B) Accuracy was highest for long, intermediate for short, and worst for equal length flankers in line with our grouping hypothesis. (C) Event-related potentials were recorded and global field power (GFP) computed, which reflects overall brain activity. The time axis is referenced to stimulus onset. The early visual response (the P1 component) reflects flanker length. P1 amplitudes are highest for long flankers, intermediate for equal length, and lowest for short flankers. Crowding strength is (inversely) reflected in the N1 component around 180–200 ms, which is highest for long, intermediate for short, and lowest for equal length flankers. Hence, it seems that it takes about 50–80 ms to transform the initial encoding into an object-based perceptual code. (D) Source localization in the N1 time window. The color scale reflects activation differences in the brain associated with crowding (difference between the long flanker and equal length flanker conditions). Particularly, sources in the lateral occipital and posterior temporal and parietal areas reflect crowding strength. Sources in the V1 do not contribute significantly. Modified from Chicherov et al. (2014).

