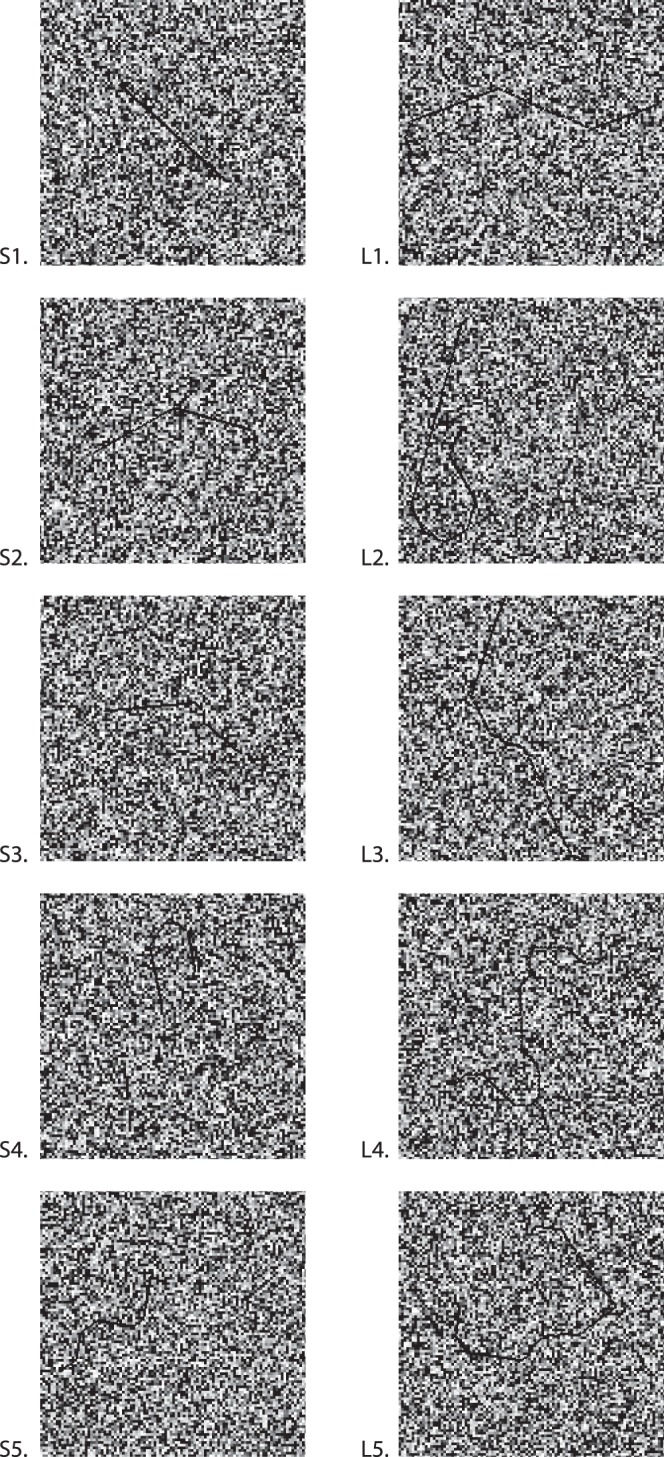
Figure 2.

Sample displays containing short contours (left) and long contours (right), showing several levels of complexity (DL). Complexity increases from top to bottom rows. Targets in this figure have augmented contrast compared to the experimental displays.
