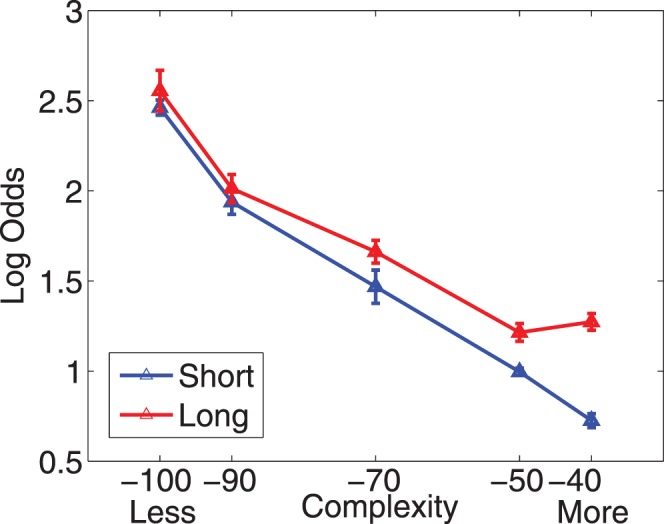
Figure 5.

Performance (log odds of a correct answer) in Experiment 1 is shown as a function of the contour complexity (DL) for all of the subjects' data combined. The red points show the detection when subjects' were shown a long contour (220 pixels) and the blue points show a short contour (110 pixels). Error bars show one standard error. For both contour lengths there is a decrease in performance with increasing complexity.
