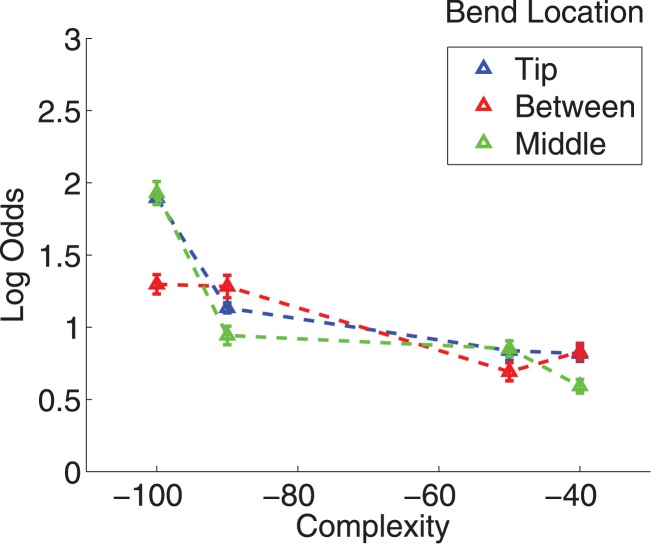
Figure 8.
Performance (log odds of a correct answer) in Experiment 2 as a function of the contour complexity (DL) for the subjects' combined data. As seen in Experiment 1, performance decreases with complexity (DL). There is no apparent difference between the different bend locations.

