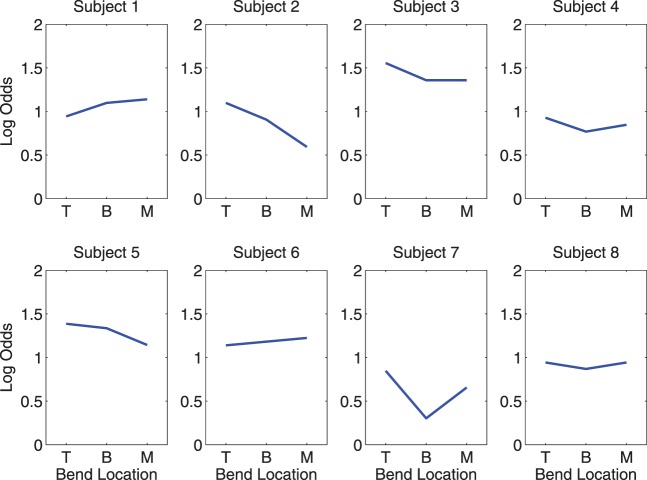
Figure 9.
For each subject, the performance (log odds of a correct answer) in Experiment 2 is shown as a function of the bend location (location of the majority of the curvature). The different bend locations are denoted by “T” (tip), “B” (between the tip and middle), and “M” (middle). There was no consistent decrease in detectability as the location was varied.

