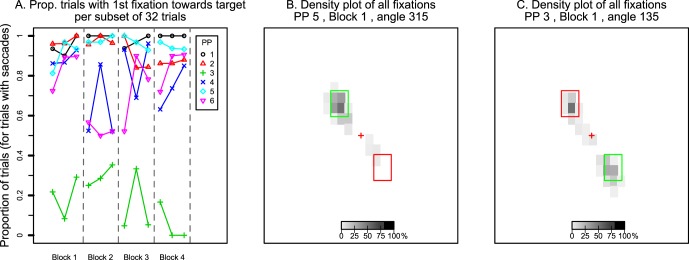
Figure 3.

(A) Percentage of trials in which participants made their first saccade toward the hidden target out of all trials with eligible saccades. Data points show values per participant per set of 32 trials. Dashed lines distinguish the four blocks of trials. (B, C) Examples of density plots of where saccades landed throughout the entire trial period. Panel B shows data of a participant who consistently made saccades only toward the target area. Panel C shows data of a participant who made saccades to both the target and the distractor.
