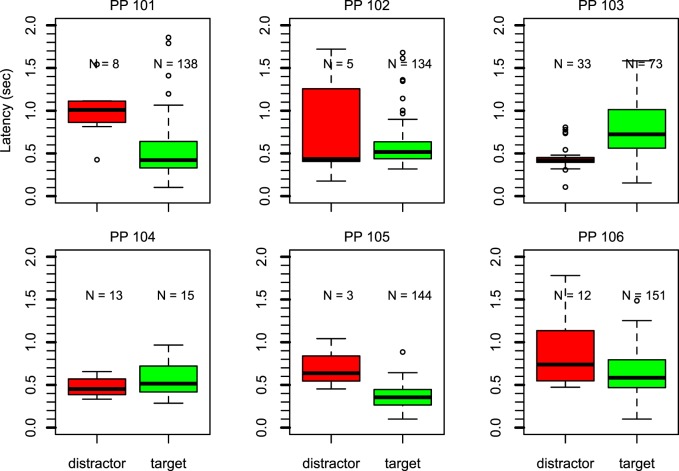
Figure 4.
Box-and-whisker plots for each participant in Experiment 1B show the latency of the first saccade for saccades toward the distractor (left, red) or the hidden target (right, green). The number above each box represents the number of observations. For five participants, the majority of first saccades went toward the hidden target.

