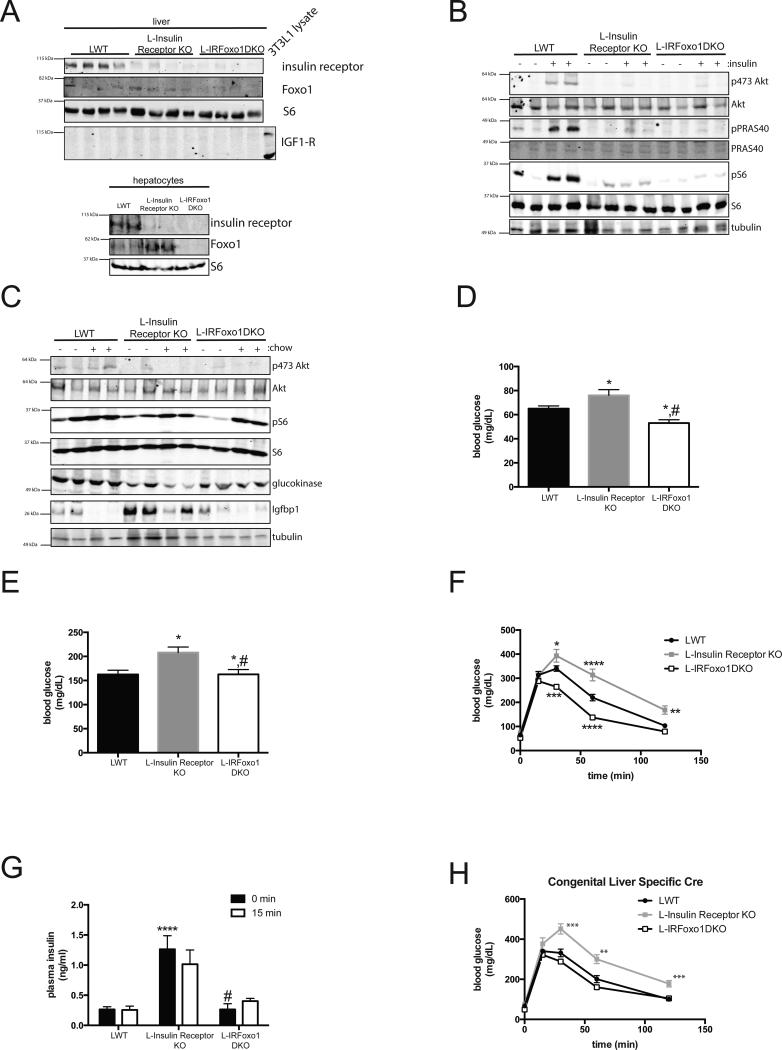
Figure 2. Liver Foxo1 deletion normalizes glucose levels and hyperinsulinemia in L-Insulin Receptor KO mice despite lack of hepatic insulin signaling.
(A) Western blot from primary hepatocyte and liver lysates of mice from indicated gentoypes probed for specific proteins as indicated. (B) Western blot of liver lysates in mice fasted overnight and I.P injected with either saline or insulin (2mU/g) and probed for specific proteins as indicated. (C) Western blot of liver lysates in mice fasted overnight and refed normal chow for 4 h and probed for specific proteins as indicated. (D,E) Blood glucose concentrations in mice after overnight fast (D) and overnight fasted following by 4 h refeeding of normal chow (E). * p<0.05 vs LWT, #p<0.05 vs L-Insulin Receptor KO. LWT group includes total of 18 mice in fasting group with n=10 IRloxP/loxP and n=8 IRloxP/loxP;Foxo1loxP/loxP and in refed group includes total of 9 mice in fasting group with n=4 IRloxP/loxP and n=5 IRloxP/loxP;Foxo1loxP/loxP. L-Insulin Receptor KO includes n=12 for fasting group and n=6 for refed group. L-IRFoxo1DKO includes n=22 for fasting group and n=7 for refed group. (F) Intraperitoneal glucose tolerance test (2 g per kg) on overnight fasted mice. LWT group includes total of 8 mice with n=6 IRloxP/loxP and n=2 IRloxP/loxP;Foxo1loxP/loxP. L-Insulin Receptor KO includes n=7 and L-IRFoxo1DKO includes n=8. *p<0.05 vs LWT, ****p<0.0001 vs LWT (G) Insulin levels before and after 15 minutes following glucose injection. LWT group includes total of 8 mice with n=6 IRloxP/loxP and n=2 IRloxP/loxP;Foxo1loxP/loxP, L-Insulin Receptor KO includes n=6 and L-IRFoxo1DKO includes n=13, for fasting group. LWT group includes total of 3 mice with n=2 IRloxP/loxP and n=1 IRloxP/loxP;Foxo1loxP/loxP, L-Insulin Receptor KO includes n=3 and L-IRFoxo1DKO includes n=8 for 15 min group. ****p<0.0001 vs LWT, #p<0.05 vs L-Insulin Receptor KO (H) Intraperitoneal glucose tolerance test (2 g per kg) on overnight fasted mice. n=7-10 mice. LWT group includes total of 6 mice with n=5 IRloxP/loxP and n=1 IRloxP/loxP;Foxo1loxP/loxP. L-Insulin Receptor KO includes n=8 and L-IRFoxo1DKO includes n=5. **p<0.01 vs LWT, ****p<0.0001 vs LWT. All data are presented as mean ± s.e.m. Statistical analysis was performed using one-way analysis of variance followed by Tukey post-test when more than two groups were compared, two-way analysis of variance followed by Bonferroni when two conditions were involved. A P <0.05 was considered statistically significant.

