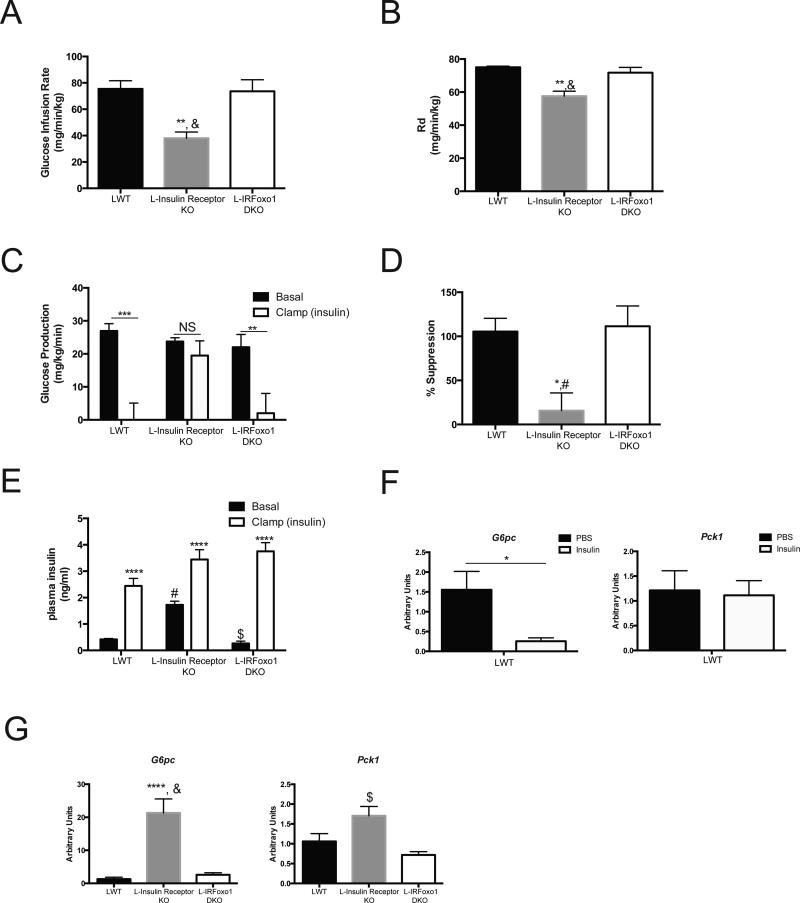
Figure 3. L-IRFoxo1DKO are insulin responsive during euglycemic clamps.
Hyperinsulinemic-euglycemic clamps were perfromed on unrestrained 5 h fasted mice using a 2.5 mU/ming/kg infusion of insulin. (A) Steady state glucose infusion rate (B) rate of glucose disposal (C) hepatic glucose production during basal and insulin portions of the clamp (D) percent suppression of hepatic glucose production during the clamp portion compared to basal period (E) insulin levels during during basal and insulin portions of the clamp. *p<0.05 vs LWT, **p<0.01 vs LWT, ***p<0.001 vs LWT, ****p<0.0001 vs LWT #p<0.05 vs Insulin Receptor KO, &p<0.01 vs L-Insulin Receptor KO, $p<0.0001 vs L-Insulin Receptor KO. LWT group includes total of 4 mice with n=2 IRloxP/loxP and n=2 IRloxP/loxP;Foxo1loxP/loxP. L-Insulin Receptor KO includes n=6 and L-IRFoxo1DKO includes n=4. ****p<0.0001 vs LWT $p<0.0001 vs L-Insulin Receptor KO. (F) Relative expression of G6pc and Pck1 under euglycemic conditions with/without infusion of 2.5 mU/min/kg of insulin for 120 mins. *p<0.05 vs PBS of indicated genotype. n=3 (PBS), n=6 (insulin). (G) Relative expression of G6pc and Pck1 under euglycemic conditions with infusion of 2.5 mU/min/kg of insulin for 120 mins. LWT group includes total of 4 mice with n=2 IRloxP/loxP and n=2 IRloxP/loxP;Foxo1loxP/loxP. L-Insulin Receptor KO includes n=4 and L-IRFoxo1DKO includes n=4. ****p<0.0001 vs LWT $p<0.0001 vs L-Insulin Receptor KO. All data are presented as mean ± s.e.m. Statistical analysis was performed using one-way analysis of variance followed by Tukey post-test. A P <0.05 was considered statistically significant.

