Figure 2.

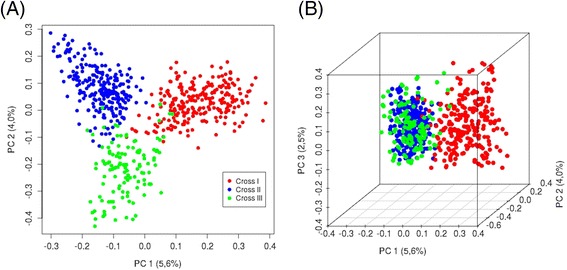
Plots of the first two (A) and three (B) principal components showing the genomic kinship between the analyzed animals. The plots visualize the overall genetic distances between the boars based on 43.527 SNP markers.

Plots of the first two (A) and three (B) principal components showing the genomic kinship between the analyzed animals. The plots visualize the overall genetic distances between the boars based on 43.527 SNP markers.