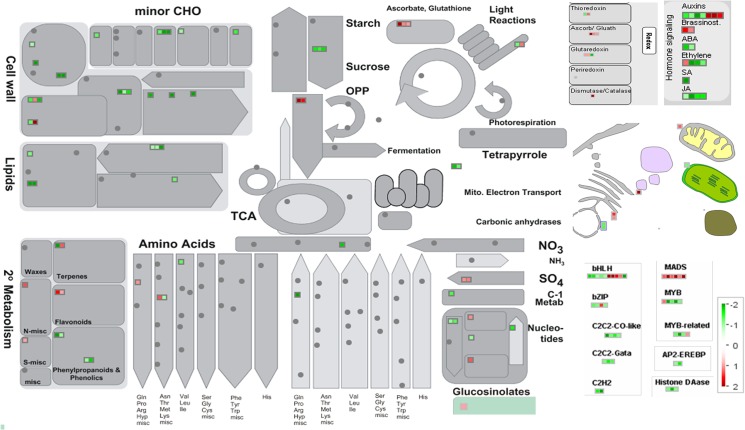
Fig 5. MapMan depiction of gene regulation in functional categories associated with different pathways.
Distribution of unigenes into different pathways, generated in MapMan, are illustrated. Log2 fold changes are indicated by the color scale, red squares represent up regulated genes and green squares represent down regulated genes. The grey circles represent genes not differentially expressed in our study.

