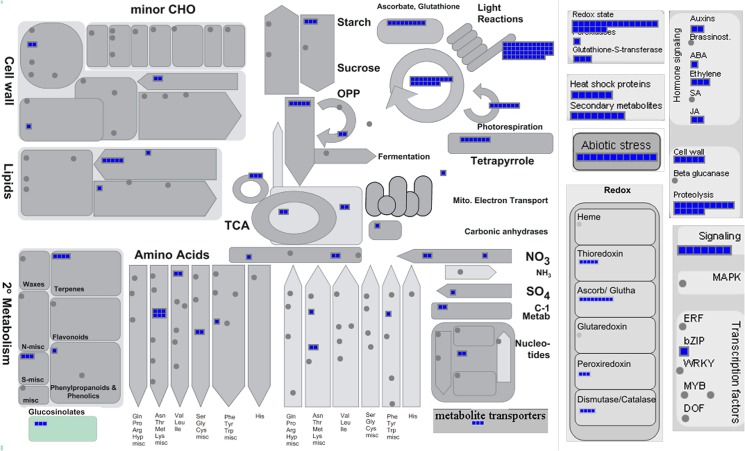
Fig 7. Mapping of high expressed unigenes on MapMan pathways.
The genes exhibiting high expression (≥100 normalized RPKM values) were mapped on functional bins assigned to different pathways in MapMan. Blue squares represent high expressed genes. Grey circles represent genes not exhibiting high expression (≥100 normalized RPKM) in our dataset.

