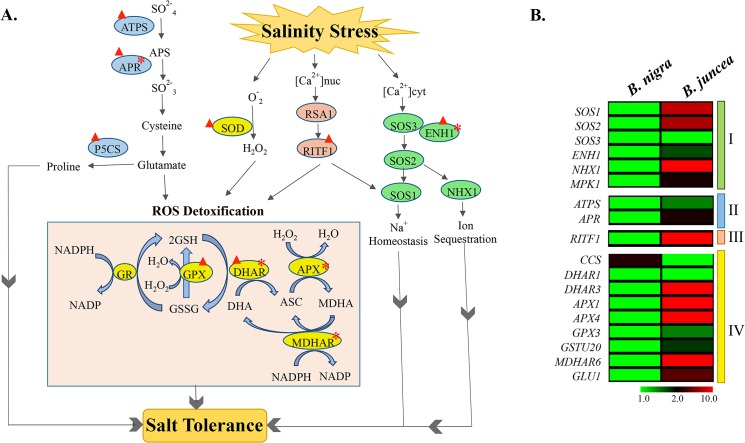
Fig 8. Schematic illustration of various cellular pathways mitigating salt stress in B. juncea var. CS52.
A) Schematic overview of key pathways and genes affected in response to salinity stress in B. juncea is presented. Information about highlighted genes was gathered from published articles. Up regulated genes and those exhibiting high expression in absence of stress are highlighted with a red upward arrow and star, respectively. ASC: Ascorbate; GSH: Glutathione; ATPS: ATP sulfurylase; APR: Adenosine 5'-phosphosulfate reductase; P5CS: Delta1-pyrroline-5-carboxylate synthetase; SOD: Superoxide dismutase; GR: Glutathione reductase; GPX: Glutathione peroxidase; DHAR: Dehydroascorbate reductase; APX: Ascorbate peroxidase; MDHAR6: Monodehydroascorbate reductase 6; AtGSTU20: Glutathione S-transferase TAU 20; GLU1: Glutamate synthase 1; CCS: Copper chaperone for superoxide dismutase; RSA1: Short Root In Salt Medium 1; RITF1: RSA1 Interacting Transcription Factor 1; SOS3: Salt Overly Sensitive 3; SOS2: Salt Overly Sensitive 2; SOS1: Salt Overly Sensitive 1; ENH1: Enhancer of sos3-1; NHX1: Sodium/Hydrogen exchanger 1; MAPK1: Mitogen-activated protein kinase. B) Heat map showing comparative expression patterns of candidate genes in B. juncea and B. nigra seedlings under normal growth conditions. Log2 expression values are indicated by the color scale with red representing high expression, black representing medium expression and green representing low level expression. The colored bars on the right demarcate genes representing different pathways. I: Ion homeostasis and sequestration; II: Sulfate assimilation; III: Gene Regulation and IV: ROS detoxification.

