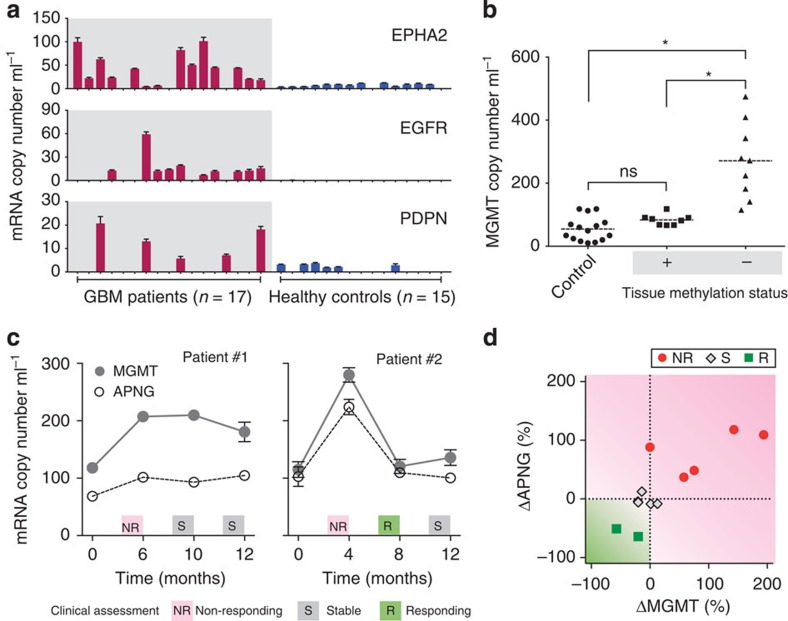
Figure 5. Analysis of clinical samples.
(a) Measurement of mRNA for EPHA2, EGFR, PDPN in serum samples. GBM patients (n=17) generally showed higher levels of markers compared with healthy controls (n=15). (b) Correlation of exosomal MGMT mRNA against tumour tissue methylation status. Tissue methylation correlates inversely with exosomal MGMT copy number. The mRNA levels were significantly higher (*P<0.001; Tukey's multiple comparison test) in GBM patients with negative tissue MGMT methylation, than that of patients with positive methylation or healthy controls. The latter categories were non-distinguishable (NS) from each other. (c) Longitudinal exosomal MGMT and APNG mRNA analyses were performed in seven GBM patients; two representative examples are shown (see Supplementary Fig. 15 for other patients). Clinical assessments (NR, S, R) were based on radiological findings, clinical examination and lab values. All changes were plotted as mean±s.d. (d) Sequential exosomal mRNA changes between two time points were analysed in GBM patients (n=7) undergoing TMZ treatment. All changes were normalized to their initial values and plotted according to clinical evaluation at the end of the assessment period (the later time point). All changes were independent of initial tissue MGMT methylation status.

