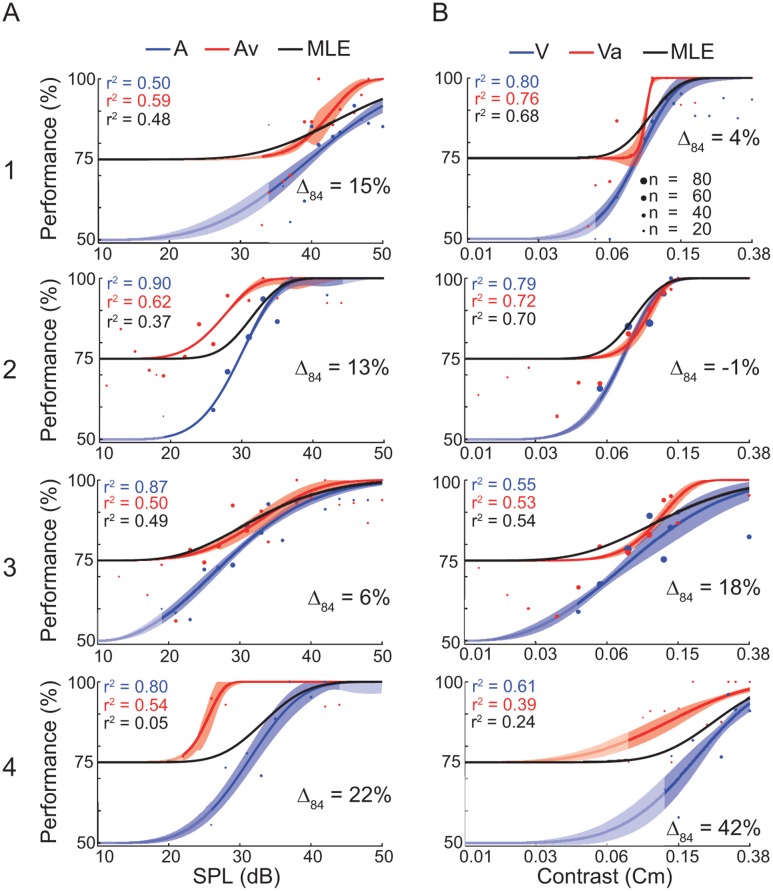
Fig 3. Detection task performance of the bimodal experiment.
(A) Data for the stimulus conditions auditory-only (A) and auditory stimulation supported by a visual stimulus (Av). (B) Data for the stimulus conditions visual-only (V) and visual stimulation supported by an auditory stimulus (Va). Each row represents one ferret (1–4). Each dot represents the average performance of N trials (diameter) at a given auditory amplitude (dB SPL) or visual contrast (Cm). The data are fitted by a Weibull function. The uni- and bimodal fit is represented by the blue and red line, respectively. The shaded area around the fit indicates the standard deviation. Δ84 displays the relative amount of threshold shift of the bimodal compared to the unimodal psychometric function at a performance of 84%. A positive shift indicates a threshold decrease. The black curve represents the MLE model. The unmasked parts of the graphs indicate the range of the actually tested stimulus amplitudes.

