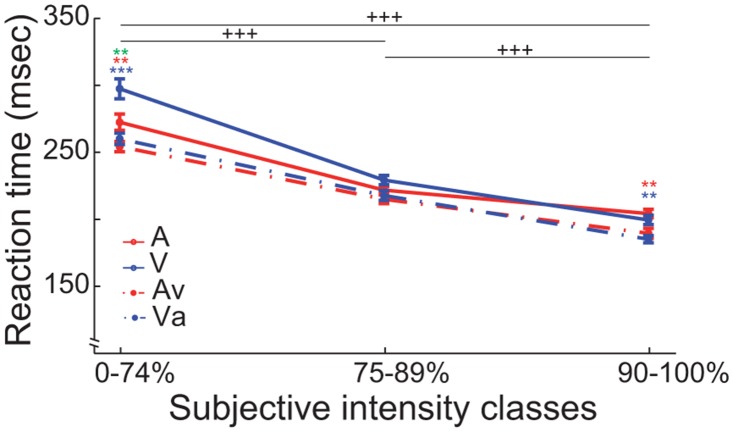
Fig 7. Reaction time: two-way ANOVA results.
The reaction times (RT) pooled by subjective intensity classes (0–74%, 75–89%, 90–100%). The X-axis displays the three performance classes and the Y-axis shows the RT in milliseconds ± SEM. The solid lines represent the unimodal, the dashed lines the bimodal, red indicates the audio and blue the visual modalities (*: p < 0.05; **: p < 0.01; ***: p < 0.001; Holm-Bonferroni corrected). +++, significant differences between performance classes within each modality (Holm-Bonferroni corrected); red and blue asterisks, significant differences between uni- and bimodal conditions in one performance class (Holm-Bonferroni corrected); green asterisk, significant difference between the two unimodal conditions.

