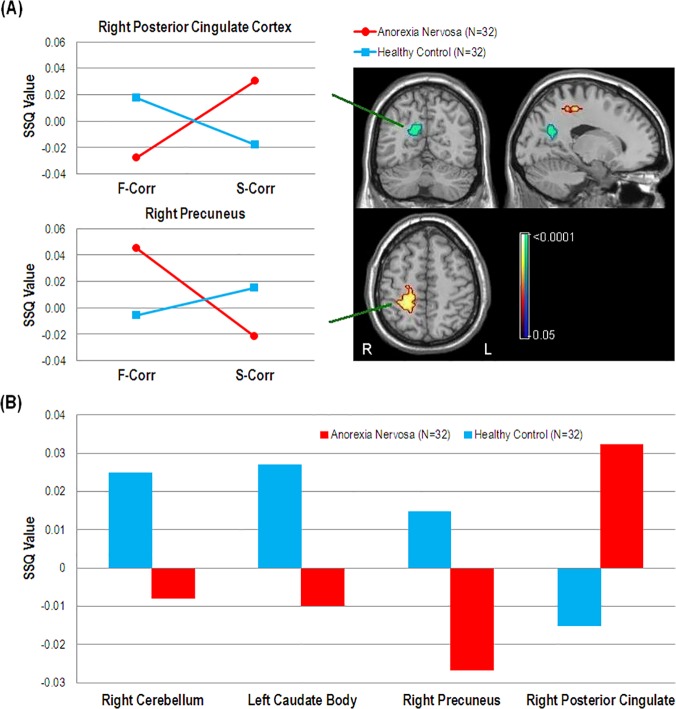
Fig 3. fMRI results of learning comparisons.
(A): Coronal, sagittal and axial views of regions showing significant group (Anorexia Nervosa, Healthy Control) by event (First Correct [F-Corr], Second Correct [S-Corr]) interactions of BOLD response (SSQ value) in the right posterior cingulate cortex (BA31, Peak activation Talairach coordinates = 14, -56, 20, cluster size = 26, p = 0.0071) and right precuneus (BA4, Peak activation Talairach coordinates = 29, -33, 42, cluster size = 33, p = 0.0026). (B): Significant difference in activity between Anorexia Nervosa and Healthy Control groups during Second Correct trials (S-Corr) in the right cerebellum (Peak activation Talairach coordinates = 7, -30, -24, cluster size = 36, p = 0.0031), left caudate body (Peak activation Talairach coordinates = -22, -26, 26, cluster size = 30, p = 0.003), right precuneus (BA31, Peak activation Talairach coordinates = 22, -30, 42, cluster size = 21, p = 0.0017) and right posterior cingulate cortex (BA31, Peak activation Talairach coordinates = 11, -56, 20, cluster size = 37, p = 0.0019). Functional data were thresholded to yield less than 1 false positive cluster and overlaid onto a high resolution single subject T1 structural image in Talairach space.

