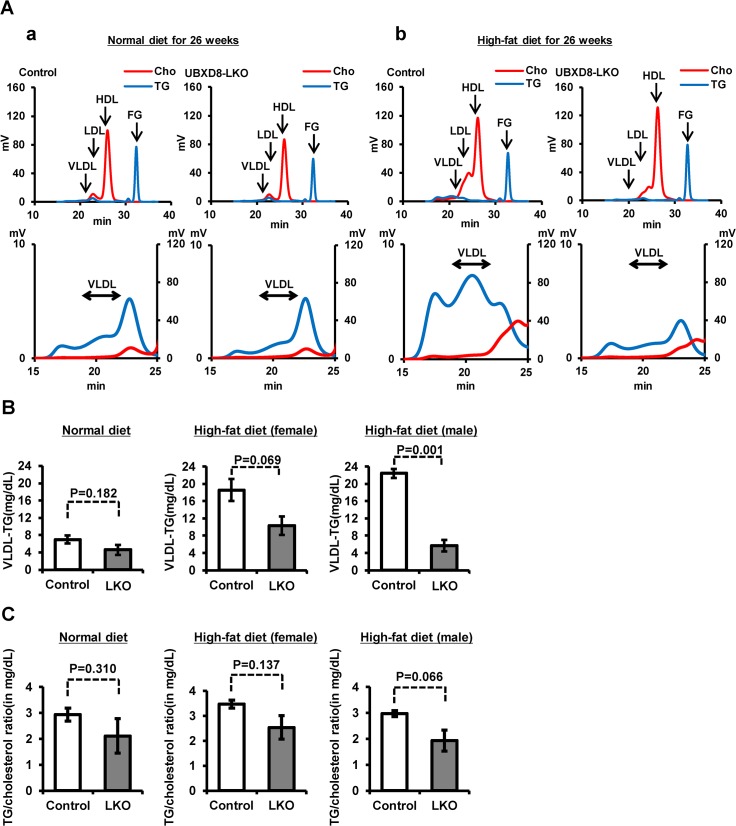
Fig 5. Analysis of serum lipoproteins.
(A) Lipoprotein profile obtained by gel filtration–HPLC of mouse serum at 30 wk old. A representative result on TG (blue) and total cholesterol (red) is shown for sera of normal and UBXD8-LKO male mice fed a normal (A) or a high-fat diet (B). Sera from female mice gave similar results. Sera for the UBXD8-LKO group fed a high-fat diet were taken from mice showing periportal steatosis. Lower panels show a magnified view of the VLDL portion. FG: free glycerol. (B) VLDL-TG was lower in UBXD8-LKO mice than in normal mice, even when they were fed a normal diet. The difference between the control and UBXD8-LKO mouse became significantly larger when mice were fed a high-fat diet. P values were obtained by non-paired Student's t test (n = 3; means ± SEM). (C) The TG-to-cholesterol ratio in VLDL tended to be lower in the UBXD8-LKO than in the control mouse. P values were obtained by non-paired Student's t test (n = 3; means ± SEM).

