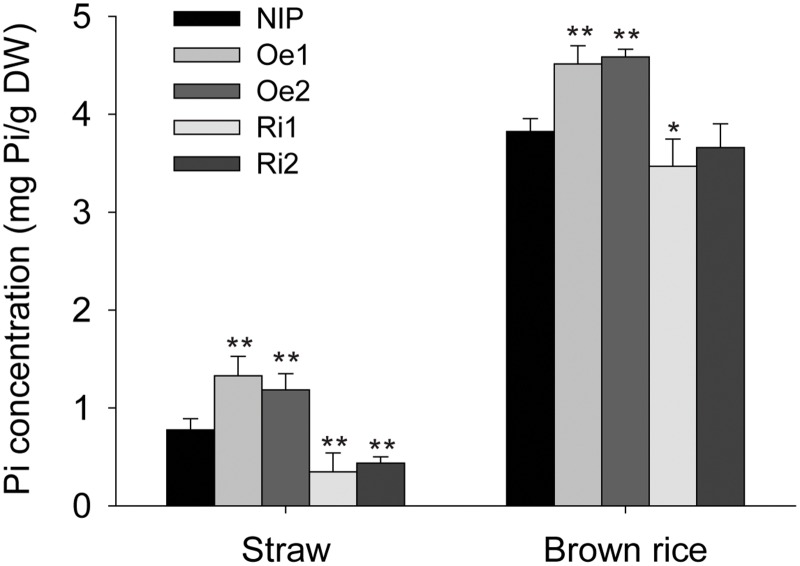
Fig 6. Pi concentration of the wild-type and transgenic plants in field.
The rice including wild type and transgenic plants were grown in field. When plants grown to maturity, the phosphate concentration of straws and brown rice were measured. Data are means ± SD of five biological replicates. Values are significantly different from those of wild-type: *P<0.05 and **P<0.01. (one-way ANOVA).

