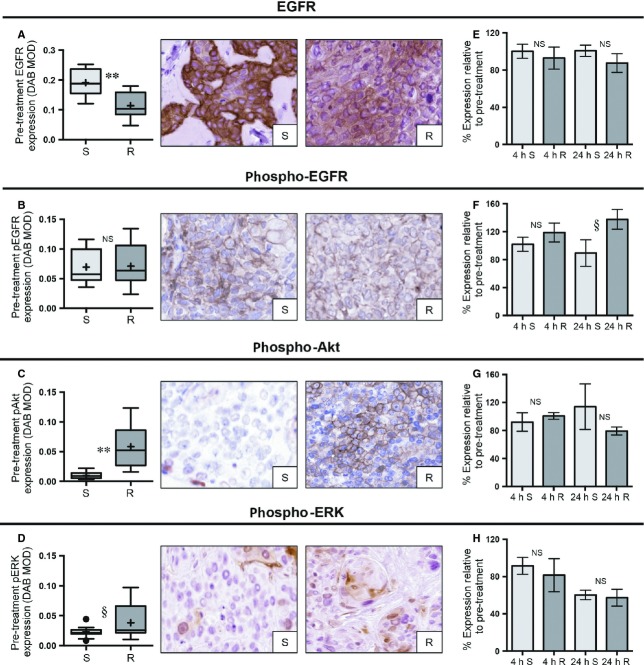
Figure 3.
Relationship between baseline and posttreatment biomarker expression and cetuximab response. (A–D) Box plots and representative IHC images comparing the baseline expression of EGFR, pEGFR, pAkt, and pERK for sensitive (S) versus resistant (R) xenografts (DAB MOD: DAB mean optical density; §P < 0.10, *P < 0.05, **P < 0.01). (E–H) Bar graphs with standard error of the mean depicting the percentage change for the expression of each indicated biomarker (relative to baseline, n = 24) in the sensitive versus resistant groups at 4 h (4 h, n = 12) and 24 h (24 h, n = 12) post treatment. NS, not significant; IHC, immunohistochemistry; EGFR, epidermal growth factor receptor; DAB, 3,3′-diaminobenzidine; MOD, mean optical density.

