
Figure 2.
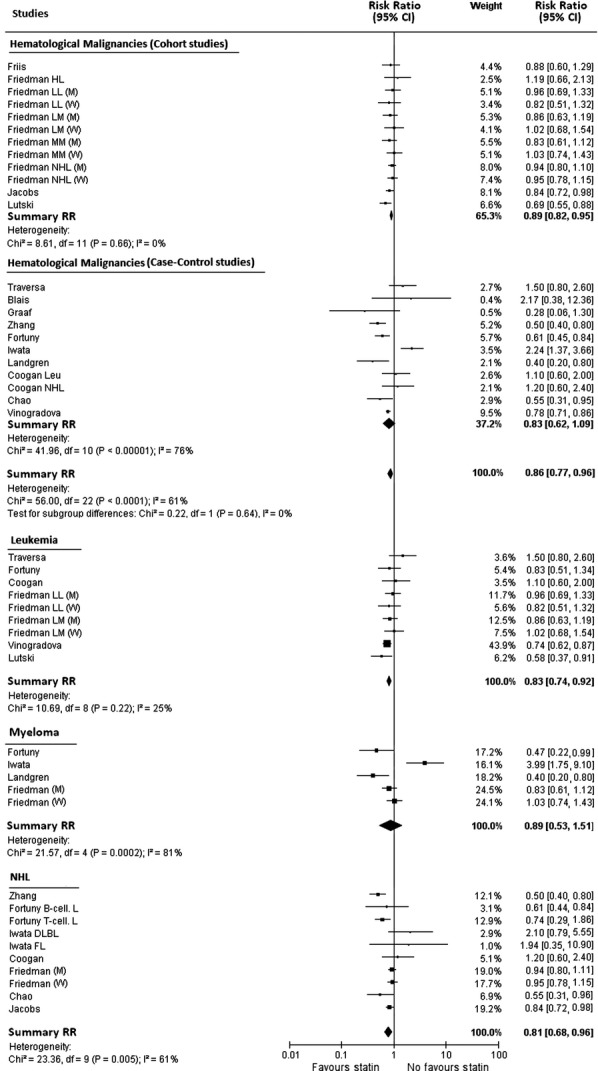
Study-specific and summary relative risk estimates for the association between use of statins and the risk of all hematological malignancies taken together, leukemia, myeloma, and non-Hodgkin lymphoma. Squares represent study-specific relative risk estimates (size of the square reflects the study-specific statistical weight, i.e., the inverse of the variance); horizontal lines represent 95% CIs; diamonds represent summary relative risk estimates with corresponding 95% CIs; P-values are from testing for heterogeneity across study-specific estimates.