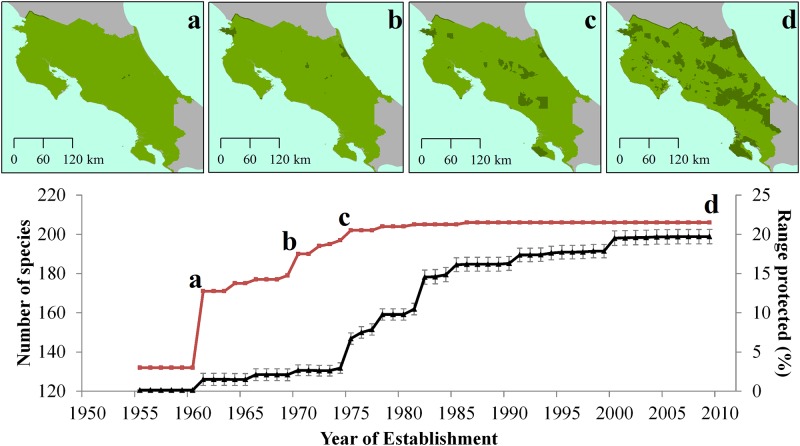
Fig 1. Chronology of protected areas establishment and number of mammal species represented in protected areas (red line), and mean percentage species ranges within protected areas (black line ± SE) in Costa Rica.
Inset maps denote locations of protected areas for each major increase in number of species protected in a) 1960, b) 1970, c) 1975 and d) 2009 as also indicated in the graph.

