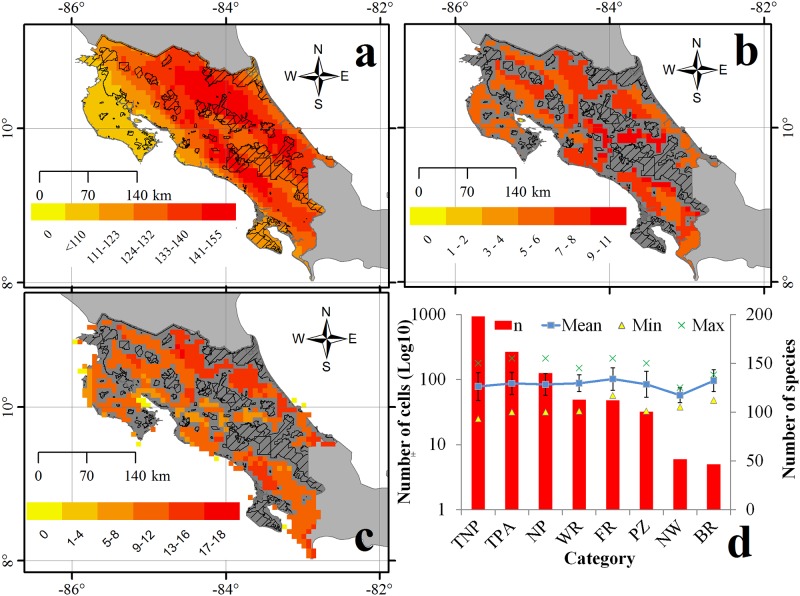
Fig 7. Mammal species richness within 83 km2 grid cells in Costa Rica and protected areas (dashed polygons).
a) Total species richness; b) number of threatened (VU, EN, CR and DD) species in cells not covered by protected areas; c) number of underprotected species (according to a priori targets; see Methods) in cells not covered by protected areas, and; d) number of cells not protected (TNP), cells in all protected areas (TPA), and cells on each protected area category (National Parks (NP), Wildlife Refuges (WR), Forest Reserves (FR), Protected Zones (PZ), National Wetlands (NW) and Biological Reserves (BR)). Secondary Y axis indicates the mean (blue line + SD), minimum (triangles) and maximum (x) number of species protected by cell in each category.

