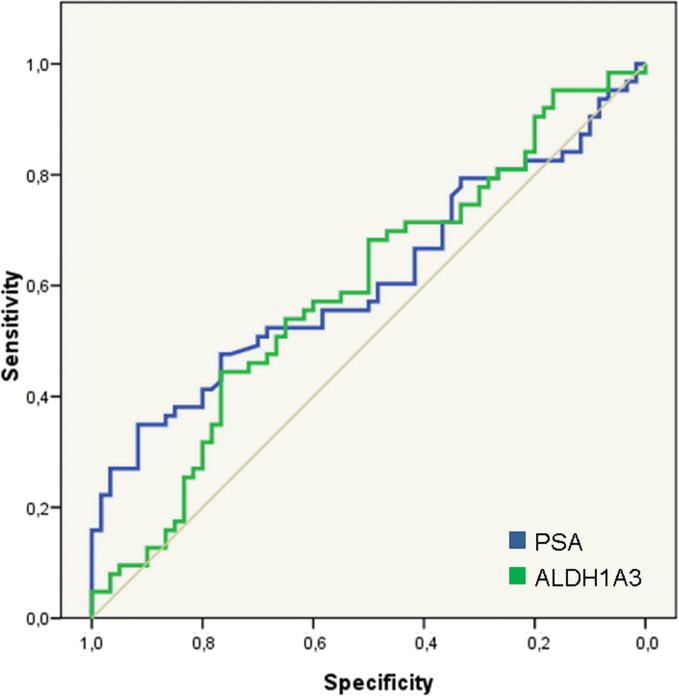
Fig 5. Diagnostic role of ALDH1A3 in urine samples.
ROC curves from PSA and ALDH1A3 for predicting PCa in urine samples. The areas under the curve are 0.610 (95%CI 0.509–0.710; p = 0.036 and 0.591 (95% CI 0.490–0.692; p = 0.083) respectively. At a significance level of 10%, both PSA and ALDH1A3 were significantly associated with a positive biopsy of PCa.

