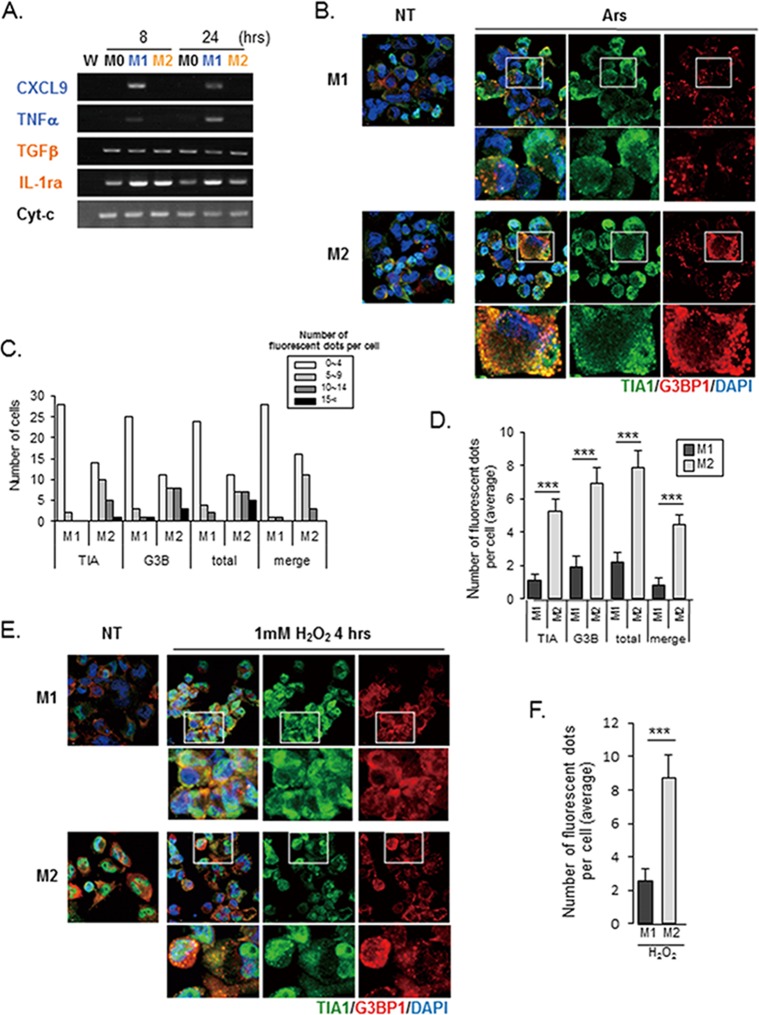
Fig 1. SG accumulation is induced by oxidative stress in M1- and M2-polarized macrophages.
(A) The upregulation of M1 and M2 biomarkers in polarized PMA-differentiated THP-1 cells was confirmed by RT-PCR analysis. PMA-differentiated THP-1 cells were either left untreated (M0) or treated with LPS and IFN-γ (M1 activation) or IL-4 and IL-13 (M2 activation); RNA was isolated 8 and 24 hours after treatment. RT-PCR was performed to determine quantitative changes in mRNAs serving as activation biomarkers. W: no template control for PCR analysis. (B-F) SG formation in response to arsenite- or H2O2-induced oxidative stress was stronger in M2-THPs than in M1-THPs. (B) M1-THPs and M2-THPs, either untreated (NT) or treated with 0.5 mM arsenite (Ars) for 30 minutes, were fixed, stained with a mouse monoclonal antibody specific for G3BP1 and goat polyclonal antibody specific for TIA-1, and then stained with Alexa 488-conjugated donkey anti-goat IgG and Alexa 568-conjugated donkey anti-mouse secondary antibodies. The cells were stained with Hoechst 33342 to visualize nuclei, and the images were merged digitally. (C,D) Cells were left untreated or treated with arsenite, and the number of distinct cytoplasmic puncta positive for TIA1, G3BP1, TIA1, or G3BP1 (total), and both TIA1 and G3BP1 (merge) was counted for each cell type. ***p<0.001 (C) The number of fluorescent dots per cell was counted in 30 cells for each cell type, and the cells were categorized as shown in the bar graph. (D) The average number of dots positive for TIA1, G3BP1, TIA1 or G3BP1, and TIA1 and G3BP1 is shown for each cell type; dots were counted in 30 individual cells of each type. Error bars indicate SD. (E) SG formation in M1-THPs and M2-THPs, either untreated (NT) or treated with 1 mM H2O2 for 4 hours, was examined by immunofluorescence as in B. (F) Bar graph showing the average number of foci positive for both TIA1 and G3BP1 per cell. Error bars indicate SD. ***p<0.001

