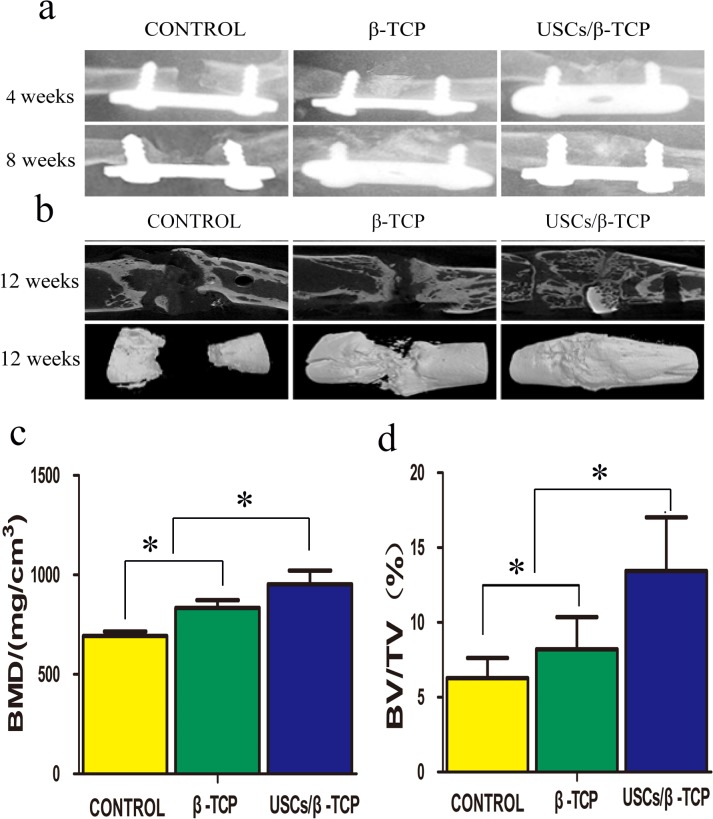
Fig 6. X-ray and micro-CT analysis of femoral defects.
The groups are listed on the upper side of image. The times are listed on the right side of the image. (a): X-ray images of the femoral defect shows callus formation and bridging the defect in USCs/β-TCP group. (b): Representative micro-CT slice and reconstructed image show the continuous callus that bridged the femoral defect in USCs/β-TCP group; scaffold only group exhibited a reparative callus but did not show bridging of the defect; and blank control group showed limited callus formation. (c) Bone mineral density (BMD) and (d) bone volume were quantified within a standard ROI placed concentrically over the defect site (*P<0.05).

