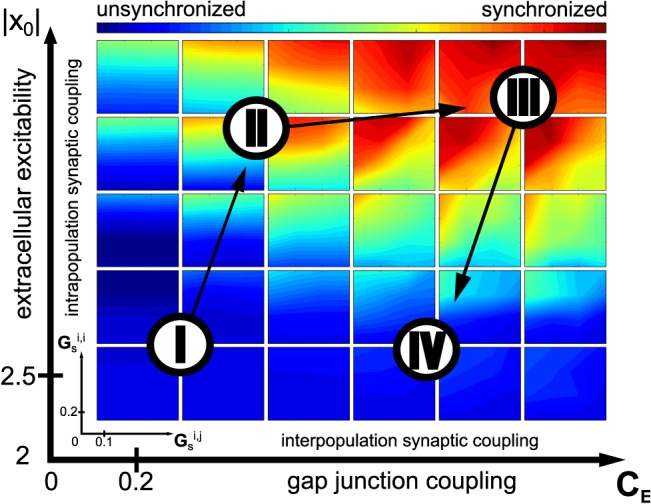
Fig 4. Parameter space during status epilepticus (SE).

Color code represents the degree of synchronization within neural populations. Roman numbers indicate the phases of the SE corresponding to the observed dynamics following Fig 2. Arrows depict the trajectory of the sequence of theses phases during the whole SE event. Inner x- and y-axis are inter (Gs i,j) and intra (Gs i,i) population synaptic coupling strength. Outer x- and y-axes are gap junction coupling strength and excitability, respectively. Axis values are given for indicative purposes and do not portray biophysical units.
