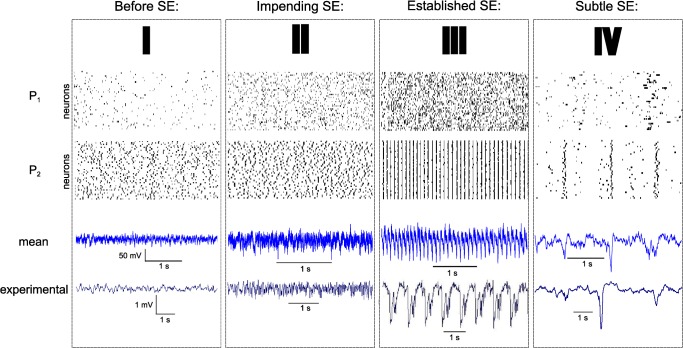
Fig 5. Population activities at different stages of status epilepticus in simulated and experimental traces.
I, II, III, and IV correspond to the area of the parameter space spanned in Fig 3. P1 (excitatory) and P2 (inhibitory) are neural populations’ raster plots, with activation threshold at 0 mV. Black points are action potentials, of which the firing rate and synchronization properties change according to the different stages of SE. The mean activity is calculated as the sum of the average of P1 neurons and P2 neurons activity, with 80% and 20% contribution respectively. All experimental traces are recorded from the same rat and shown here before and after chemically-induced SE.

