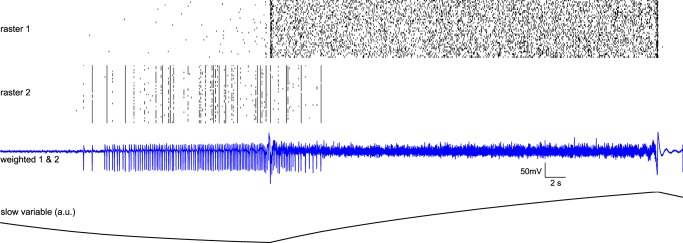
Fig 7. Simulated seizure-like event in the absence of glutamatergic and GABAergic synaptic couplings.

Raster plots 1 & 2 display spikes of population 1 and 2 neurons, with activation threshold at 0 mV; third trace is the mean of the two populations with 80% contribution of excitatory ensembles and 20% contribution of inhibitory ensembles; slow permittivity variable is the z variable from Eq 3 (in arbitrary unit), mainly affected by excitatory cells, exerting a inhibitory effect on inhibitory cells upon exogenous factors; bottom plot is experimental data. Parameters: CE = 0.8; x0 = 3.0;Wmax = 0.2; Gs i,j = 0; Gs i,i = 0; r = 0.000004.
