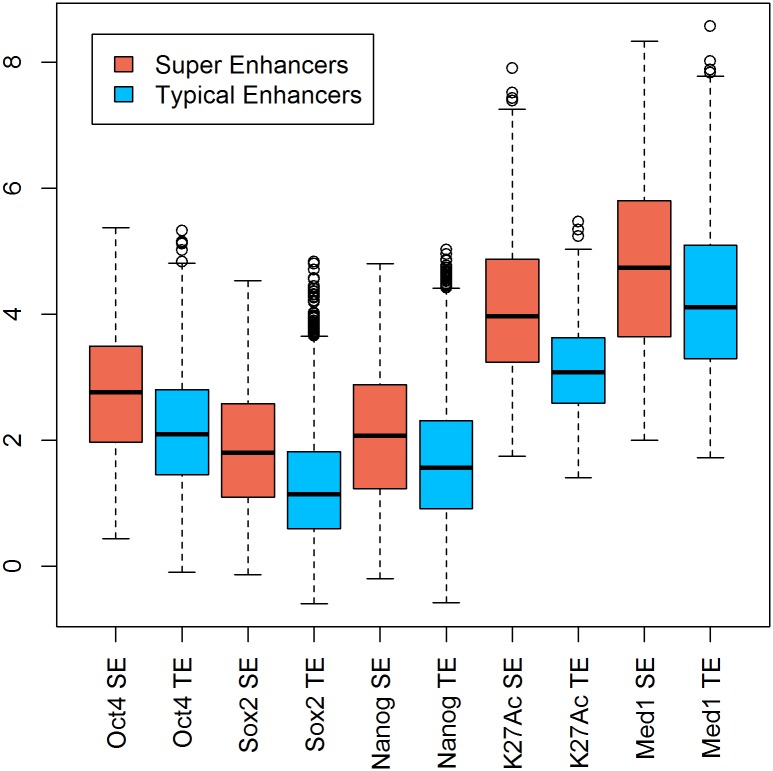
Fig 3. Signal Distribution of Key Transcription Factors in Super Enhancers and Typical Enhancers.
Quantitative applications of PAPST compared peak signals within super-enhancers (SEs) to those within typical enhancers (TEs) of five factors showing significantly stronger signal in SEs. Red: peak signal distribution within super-enhancers. Green: peak signal distribution within typical enhancers. Peak signals are expressed as normalized read counts. All comparisons are significant with p < 1e-10 (Welch's t-test).

