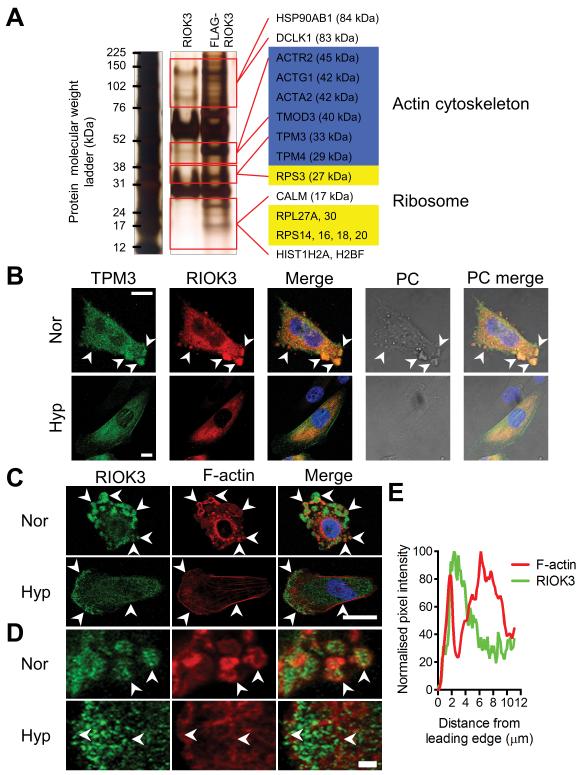
Figure 4.
RIOK3 associates with TPM3 and actin in cells. (A) Silver-stained PAGE gel of anti-FLAG immunoprecipitates from MDA-MB-231 cells expressing either RIOK3 or FLAG-RIOK3. Species detected by tandem mass spectrometry only in the FLAG-RIOK3 sample are indicated on the right of the gel by gene symbol. (B) Confocal images of MDA-MB-231 cells in normoxia (Nor) and hypoxia (Hyp) demonstrate colocalisation of RIOK3 and TPM3. Scale bar = 10 μm. Phase contrast (PC) images show changes in cellular appearance. (C) Confocal images of MDA-MB-231 cells demonstrate that RIOK3 associates with actin. In normoxia RIOK3 aggregates are often surrounded by F-actin (arrowheads). In hypoxia RIOK3 aggregates disperse and F-actin organisation changes to form stress fibers and a dense F-actin network adjacent to the leading edge (arrowheads). Scale bar = 20 μm. (D) Magnified images of regions in C. Scale bar = 2 μm. (E) Pixel density of F-actin and RIOK3 stain at the leading edge of the hypoxic cell (from D). F-actin is observed immediately adjacent to the cell edge, followed by an intense band of RIOK3 stain and then a by a wider band of F-actin.

