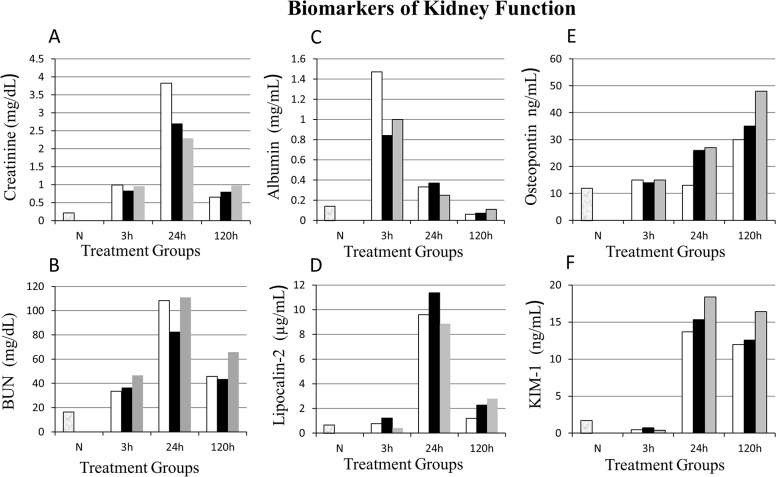
Fig 2. Kidney functional biomarker analysis.
X-axis represents treatment groups (n = 8/group): Vehicle control (white bars □), Valproic Acid (VPA; black bars ■), and Dexamethasone (grey bars ■). N, Normal (naïve) uninjured and untreated rats (n = 5). Y-axis represents concentration of each biomarker in the blood (creatinine, blood urea nitrogen [BUN]) and urine (albumin, lipocalin-2, osteopontin, kidney injury molecule-1[KIM-1]). In VPA treated animals albumin level were markedly lower at three hours (h) while the creatinine and BUN values were lower at 24 h post ischemia-reperfusion (IR) compared to vehicle controls. However, lipocalin-2 and KIM-1 were higher at 24 h in all the groups (VPA, Dex, Vehicle) studied. See Tables 1 & 2 for statistical significance between treatment groups and with time post ischemia-reperfusion.

