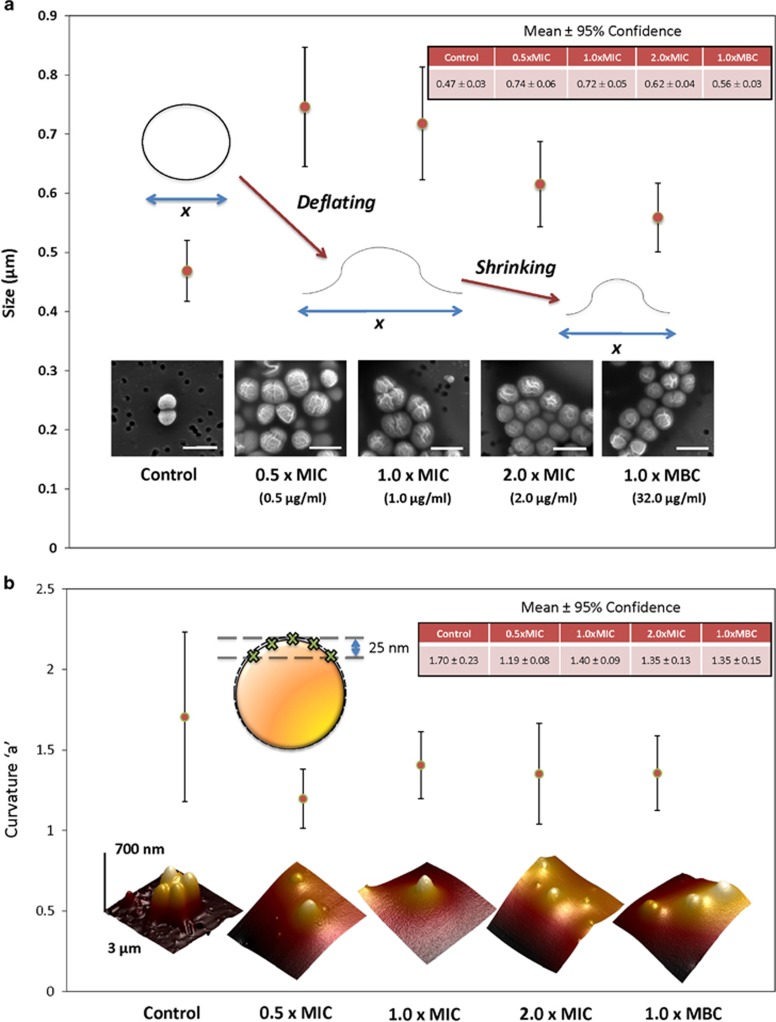
Figure 3.
Microscopic analysis of S. aureus ATCC 29213 treated with 10 at different concentrations. (a) SEM images and size measurements of S. aureus with an inset showing the mean±95% confidence (n=12). Scale bar 1 μm and magnification ~ × 85 000. (b) The change in the ‘a' parameter (representing bacteria curvature) is shown with representative 3D AFM images beneath (3 μm × 3 μm × 700 nm). The top 25 nm of an AFM scan was used as a basis for a parabolic equation fit y=ax2+bx+c to show the change in curvature after treatment with the drug. The inset shows the mean±95% confidence (n=10 for 1 × MBC and n=20 for other concentrations). A full color version of this figure is available at The Journal of Antibiotics journal online.

