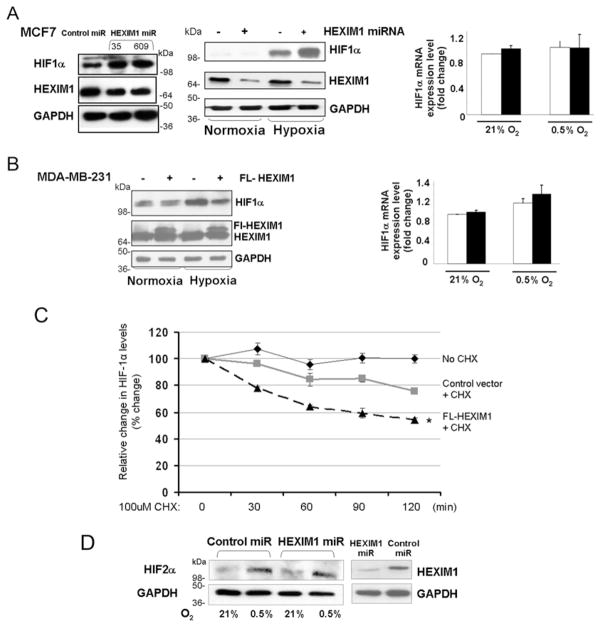
Figure 1. HEXIM1 destabilizes HIF-1α protein.
(A) MCF7 cells were transfected with the expression vector for control miRNA or HEXIM1 miRNA. Shown are representative Western blots (left-hand panels, representative of five experiments) or RT–PCR (right panel, representative of three experiments) indicating HIF-1α levels under normoxia and hypoxia. (B) MDA-MB-231 cells were transfected with control vector or expression vector for FLAG (FL)–HEXIM1. Shown are representative Western blots (left-hand panel, representative of four experiments) or RT–PCR (right-hand panel, representative of three experiments) indicating HIF-1α levels under normoxia and hypoxia. (C) Cells were transfected with expression vector for HEXIM1 or empty vector. The cells were incubated under hypoxia for 8 h as indicated. At the end of treatment, 100 μM cycloheximide (CHX) was added to the medium for the indicated time periods. The expression of HIF-1α and GAPDH were analysed by Western blot analysis. The density of the HIF-1α protein band was determined using an image analysis system. The values were normalized to GAPDH and expressed as percentage change relative to the time zero. Graphs show means±S.E.M. from three experiments. *P < 0.05 compared with control transfected cells with no CHX. Statistical significance was based on one-way ANOVA. (D) HIF-2α levels were analysed by Western blot analyses of cell extracts from MCF7 cells transfected with expression vector for control miRNA or HEXIM1 miRNA and subjected to hypoxia treatment. The results are representative of two experiments. Molecular masses in kDa are shown next to the Western blots.

