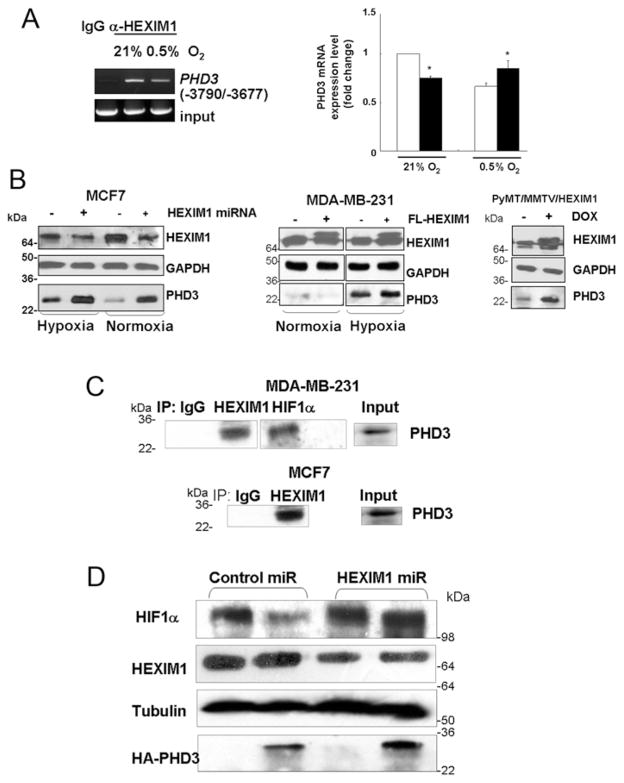
Figure 3. HEXIM1 up-regulated expression and interaction with PHD3.
(A) Left-hand panel, ChIP analyses of MCF7 cell lysates immunoprecipitated with antibodies against HEXIM1 or control non-specific rabbit immunoglobin, followed by PCR amplification of the −3790/−3677 region of the PHD3 gene. Panels are representative of three experiments. Right-hand panel, PHD3 mRNA levels in control and FLAG (FL)–HEXIM1-transfected MDA-MB-231 cells were quantified and normalized to GAPDH. Panels are representative of three experiments. (B) Representative Western blots indicating regulation of PHD3 by HEXIM1 in hypoxia-treated MCF7 cells and MDA-MB-231 cells. Panels are representative of three experiments. Also shown is a representative Western blot of PHD3 expression in tumour lysates from control and doxycycline-treated PyMT/MMTV/HEXIM1 mice. Blots were probed with anti-GAPDH antibody as a loading control. Panels represent five mice per group [±doxycycline (DOX)]. (C) MCF7 cells and MDA-MB-231 cells were subjected to hypoxia treatment (8 h). Lysates were immunoprecipitated (IP) using the antibodies indicated and analysed for co-immunoprecipitating proteins by Western blotting using anti-PHD3 antibody. Normal rabbit immunoglobulin was used as a specificity control. Input lanes represent 25 % of the total protein. Panels are representative of three experiments. (D) Expression of HIF-1α under hypoxic conditions in control miRNA and HEXIM1 miRNA transfected MCF7 cells and in the absence or presence of HA-tagged PHD3 were analysed by Western blot analyses. Panels are representative of at least three experiments. Molecular masses in kDa are shown next to the Western blots.

