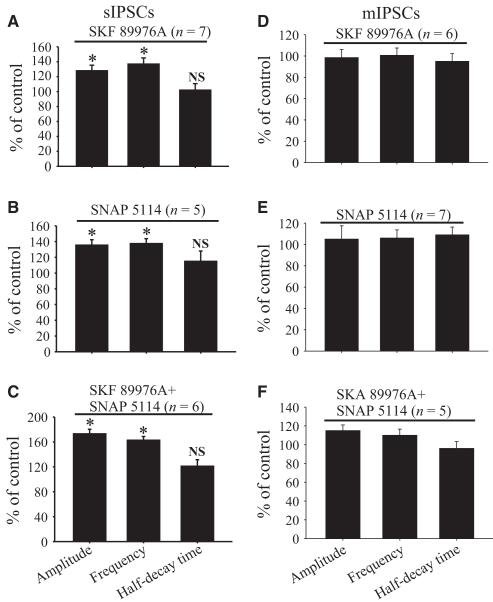
Fig. 7.
Summary bar graphs showing effects of SKF 89976A (A and D), SNAP 5114 (B and E) and SKF 89976A together with SNAP 5114 (C and F) application on the amplitude, frequency and half-decay time expressed as percentage of control ± SEM of sIPSCs (A–C) or mIPSCs (D–F) in the rat GP. (*Significant differences from control conditions, P = 0.001.)

