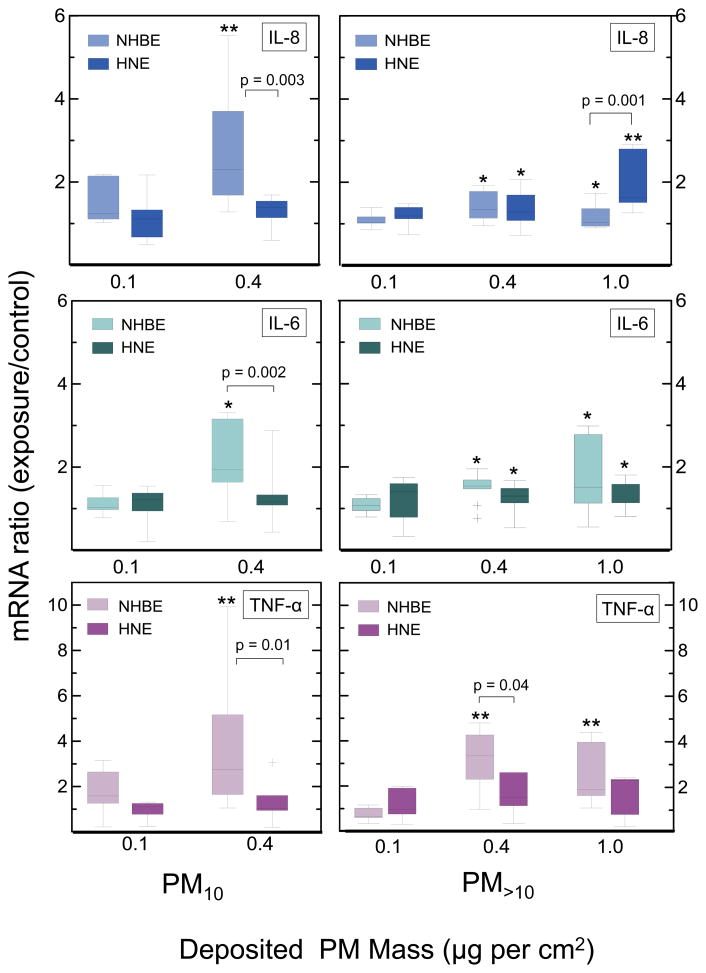
Figure 2.
Box-whisker plots of transcript production in ALI NHBE and HNE cells exposed to PM10 (left panel) and PM>10 (right panel) size fractions. All transcript levels are normalized to HEPA-air controls. (+) signifies outliers. * signifies p<0.05, ** signifies p<0.0001, when compared with controls. P-values shown in plots are p-values for cell type differences.

