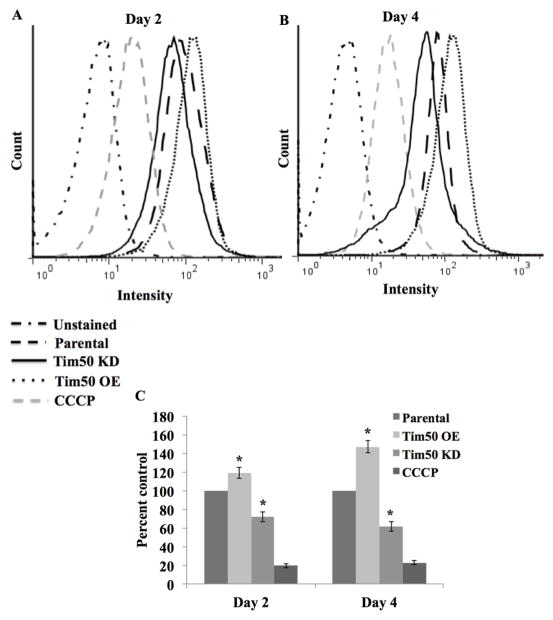
Fig. 2.
Effects of TbTim50 up- and down-regulations on the mitochondrial membrane potential. The TbTim50 KD and OE cells were induced with doxycycline and cells (2 x 10⁷) were harvested at day 2 (A) and day 4 (B). Live cells were stained with Mitotracker Red as described in the materials and methods. Cells were fixed with para-formaldehyde, washed and resuspended in cold PBS for FACS analysis. Fluorescence intensity was measured with a FACSCalibur (Becton Dickinson) analytical flow cytometer using absorption at 578 nm and emission at 599 nm. Flowjo software was used to analyze the results. Parental cells were also pre-treated with carbonyl cyanide m-chlorophenyl hydrazine (CCCP) at a final concentration of 50 μg/ml to disrupt mitochondrial membrane potential. (B) Quantitation of the fluorescence intensity from triplicate samples was performed using the same software. Fluorescence intensity of TbTim50 OE and KD cells were calculated as percent of that in the parental control in respective days. Values shown are mean ±standard errors (*p <0.05).

