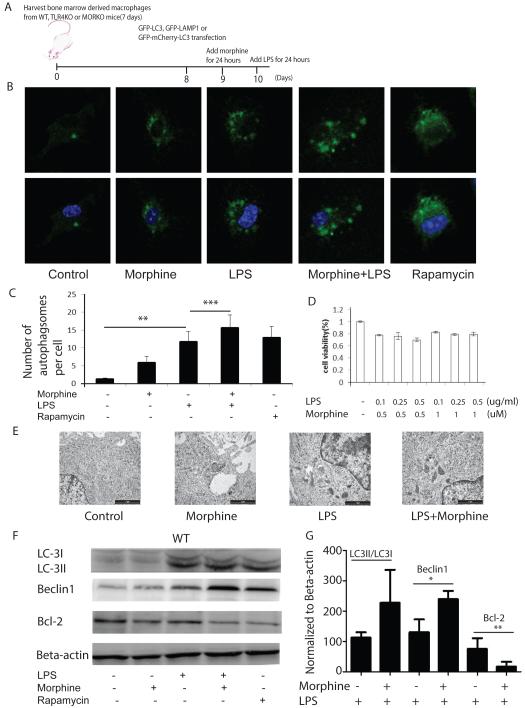
Figure 1. Morphine potentiates LPS-induced autophagy initiation.
(A) Schematic diagram of experimental design. (B) Upper panel: BMDMs were transfected with GFP-LC3, and treated with morphine in the absence or presence of LPS for 24 hours. Nuclei were labeled with DAPI. Rapamycin was used as a positive control. Representative images are shown. (C) Quantification of the number of autophagosomes in a single cell. Confocal images were obtained at 600×magnification. **, P<0.05. ***, P<0.05. (D) Cell viability analysis was determined using a MTT assay. (E) BMDMs were treated with morphine 24 hours before LPS treatment for 24 hours. Cells were then analyzed by TEM. Images were obtained at 40,000× magnification using a JEOL 1200 EX transmission electron microscope (JEOL, Peabody, MA, USA). Scale bar: 1 μm. (F) BMDMs were treated with morphine for 24 hours and then treated with LPS for an additional 24 hours. Cell lysates were separated on 10% SDS-PAGE and levels of LC3II/I, Beclin1 and Bcl-2 were determined by Western blot. (G) Densitometric analysis of LC3II/I, Beclin1 and Bcl-2 expression levels. Values represent percentage changes from control of LC3II/LC3I, Beclin1 or Bcl-2 normalized against beta-actin. *, **, P<0.05. Replicated experiments gave similar statistical significances. The data demonstrate that morphine potentiates LPS-induced autophagy initiation indicated by autophagosome formation, increase in LC3II/LC3I conversion and Beclin1 expression.

