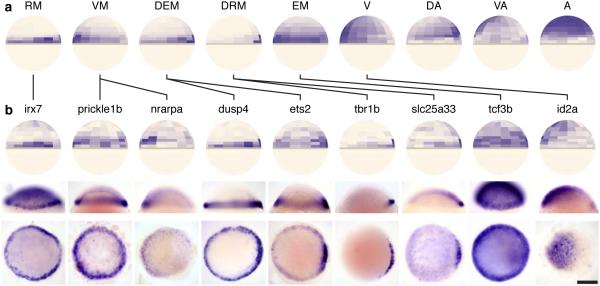
Figure 4. Nine archetypal patterns discovered through spatial clustering.
(a) We calculated imputed expression patterns based on Seurat’s spatial mapping for 290 highly variable genes (Methods). Genes were then clustered by their imputed spatial localization (Supplementary Fig. 5) into 9 ‘archetypes’ that broadly describe the patterns of multiple genes: RM, restricted to margin; VM, ventral margin; DEM, dorsally enriched margin; DRM, dorsally restricted margin; EM, extended margin; V, ventral; DA, dorsal animal; VA, ventral animal; A, animal. (b) Genes were selected from various archetypes that did not have published (assessed on Sep. 4, 2014), expression patterns at 50% epiboly and then analyzed by RNA in situ hybridization. Top to bottom: Seurat’s predicted expression pattern, a lateral view of the in situ (dorsal to the right), and an animal cap view of the in situ (dorsal to the right). Experimentally determined patterns exhibit high accord with Seurat’s predictions, as described in the main text. Genes are connected to the archetype with which they clustered by black lines. Scale bar represents 200 µm.

