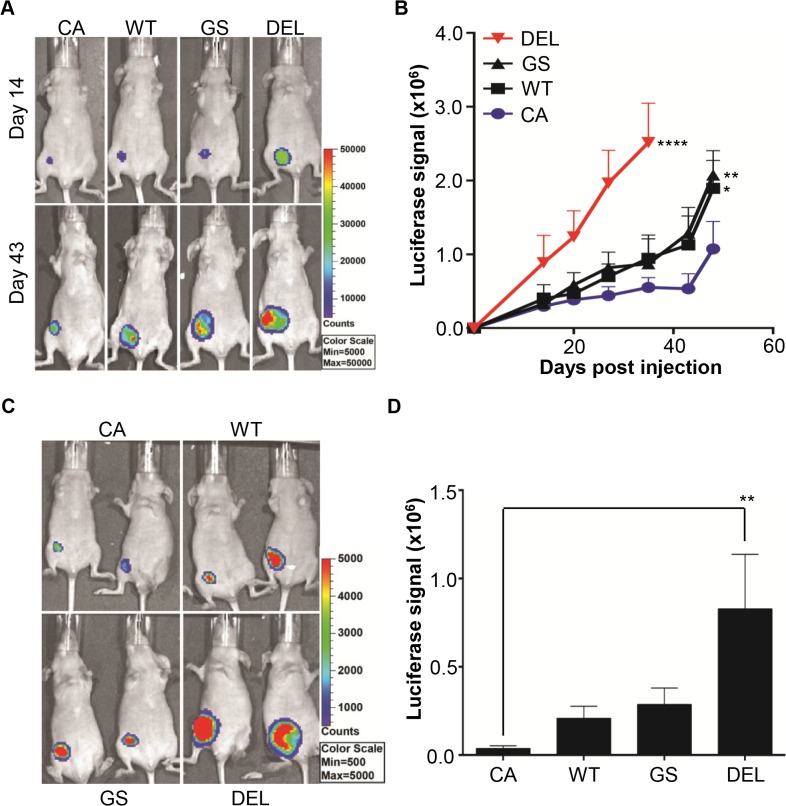
Fig 3. Overexpression of wild type or mutant EGFR increases the growth of MCF10CA1a mammary fat pad xeongrafts.
Female BALB/c nude mice were injected in the mammary fat pad with 5x10⁶ cells from the indicated cell line and tumour formation was monitored with bioluminescent imaging. CA: MCF10CA1a-EV, WT: MCF10CA1a -EGFR-WT, GS: MCF10CA1a -EGFR-GS, DEL: MCF10CA1a -EGFR-DEL A. Representative bioluminescent images of individual mice taken on day 14 and day 43. B. Plot of the increase in luciferase signal in each group of mice (*p<0.05, **p<0.01, ****p<0.0001, n = 5, vs CA control, One-Way ANOVA). C. Representative bioluminescent images of individual mice taken on day 49 post injection in an independent cohort of mice. D. Plot of the magnitude of luciferase signal in each group of mice at day 49 post injection (**p<0.01, n = 5).

