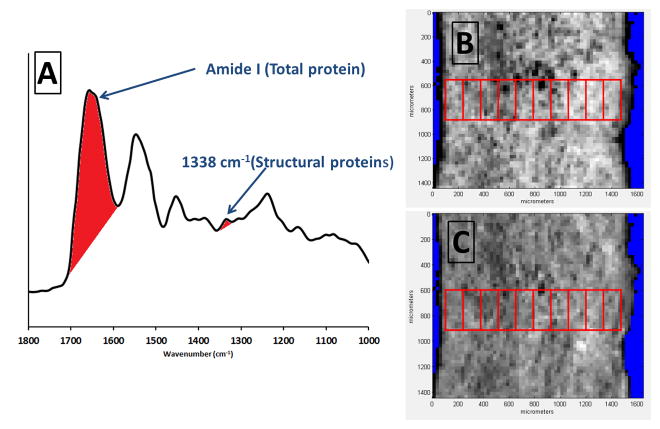
Figure 3.
a) Peak integration of amide I band for mapping total protein content and the band centered at 1338 cm−1 for mapping structural proteins (collagen and elastin), b) Intensity image of total protein content from peak integration mapping of amide I band in a typical sample and selection of region of interest and sub-regions. c) Intensity image of structural proteins from peak integration mapping of the 1338 cm−1 band in the same sample and selection of region of interest and sub-regions.

