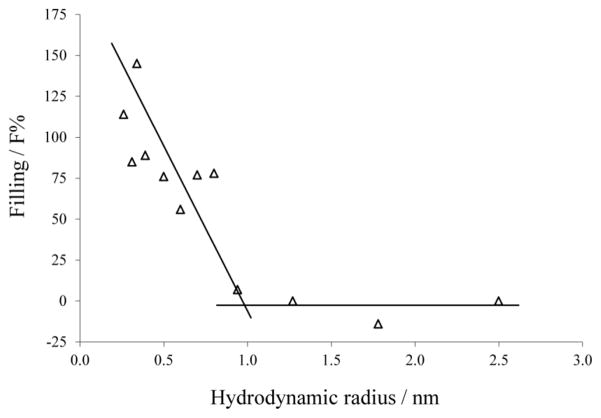
Fig. 6. K. kingae RtxA channel filling (F%) dependence on the NEs hydrodynamic radii.
F% for each NE was calculated according to Eq. 2. Lines are best fits to the experimental points. The horizontal lines connect the points derived from measurements in the presence of PEG 1000, PEG 2000, PEG 3350, and PEG 6000. The other line regression was used to describe the points for the NEs with radii ranging from 0.26 nm to 0.8 nm (ethylenglycol, glycerol, arabinose, sorbitol, PEG 200, PEG 300, PEG 400, and PEG 600). Hydrodynamic radii of the NEs are presented in Table 3.

