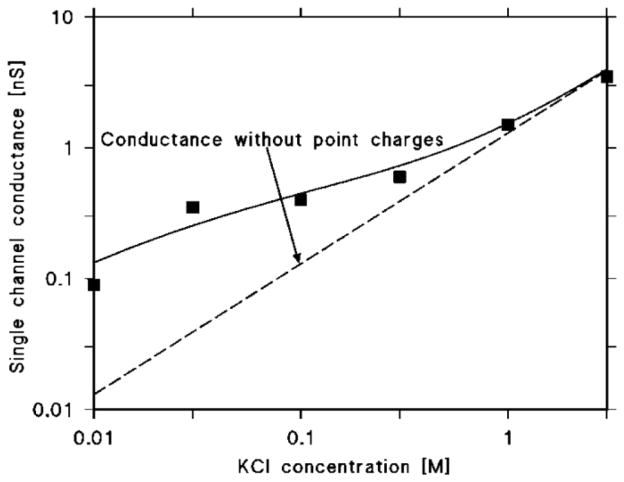
Fig. 7. Single channel conductance of K. kingae RtxA as a function of the KCl concentration.
The squares represent the conductance of RtxA in different concentrations of KCl in the solution. The solid line represents the fit of the single channel conductance as described in the methods [76, 77] and assuming the presence of 2 negative charges (q=−3.2·10−19 As) at both sides of the membrane and a channel radius of 0.9 nm. The dashed line corresponds to the single channel conductance of the RtxA channel in the absence of point charges and represents a linear function between the channel conductance and the salt concentration.

