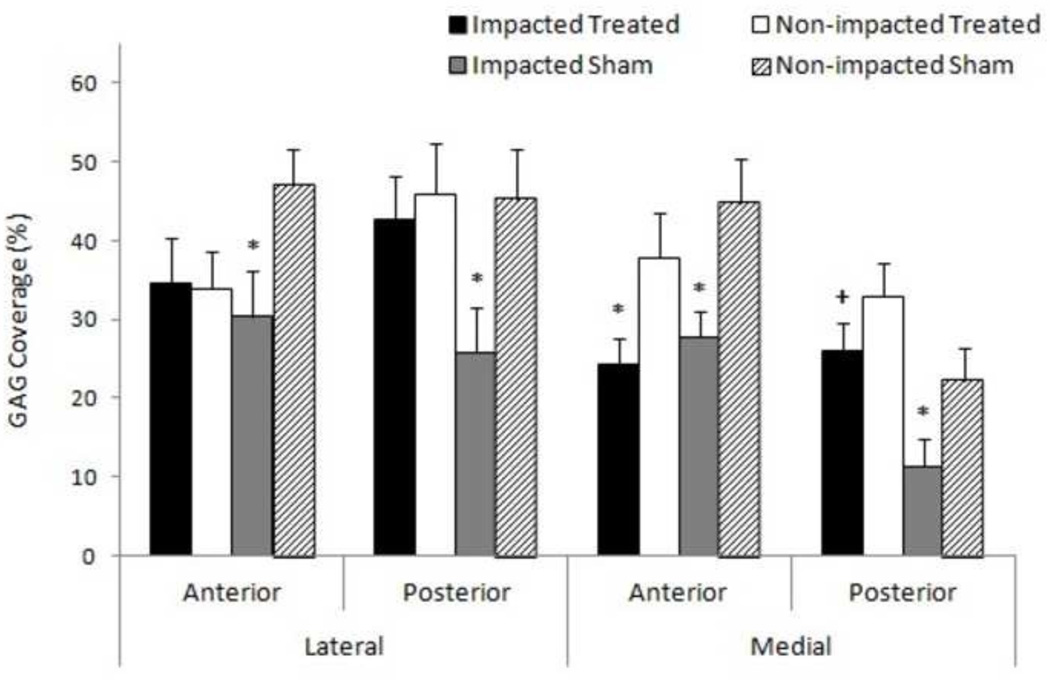
Figure 3.
Comparison of meniscal GAG coverage 6 weeks post impact. * denotes significant difference between respective impact group and paired control (p<0.05). + represents statistical difference between impacted treated and impacted sham groups of same region on respective hemijoint, (p<0.05). Mean + standard error of the mean.

